


Last updated on May 12th, 2026 at 06:08 pm

Veteran market analyst Peter Brandt has identified a rare “Horn” pattern on the Bitcoin ($BTC) daily chart, signalling a potential shift in the asset’s recovery structure as it climbs back toward $73,000.
Brandt, who successfully predicted the 2018 Bitcoin crash, noted on March 16, 2026, that “The Banana is splitting,” referring to a broadening chart formation that historically precedes significant volatility. This “Horn” pattern, first described by Richard W. Schabacker in 1934, appears as the rounded “Little Banana” recovery arc begins to open outward, suggesting a breakout that could propel $BTC into the mid-$80,000s.
The Banana is splitting
This is a Horn
Richard W. Schabacker wrote about this in his 1934 book$BTChttps://t.co/F2gFFp7sxj pic.twitter.com/GbNPB4ncS3— Peter Brandt (@PeterLBrandt) March 15, 2026
The current technical setup follows a sharp market correction in late January and early February 2026, where Bitcoin touched a macro “green support band” near $60,000. Brandt describes this long-term parabolic channel as the “Big Banana,” which has guided Bitcoin through multiple bull cycles over the last decade.
The “Little Banana” currently forming on the daily chart represents a short-term rounded bottom precisely at this macro support level, creating what Brandt calls a “Banana Split” setup.
The Bitcoin banana split pattern
Traders often search for Brandt’s unique terminology to understand his bullish forecasts. The “Banana Split” occurs when a short-term rounded channel (the Little Banana) aligns with the multi-year macro support line (the Big Banana). Brandt’s analysis suggests that when these two curves line up, the resulting momentum often leads to a sharp upward breakout. As of March 16, Bitcoin traded near $72,813, testing the upper boundaries of this consolidation range.
Investors are also talking about the “Horn” pattern as a rare broadening formation. By invoking Richard W. Schabacker’s 1934 technical analysis, Brandt is framing the current $BTC setup as a classical geometric formation rather than a temporary crypto meme. Unlike standard wedges that tighten, a Horn pattern expands, indicating that the price path is becoming more volatile as it prepares for a major move. If $BTC secures a daily close above the $74,116 resistance level, analysts suggest the next upside target could be $79,297 or higher.
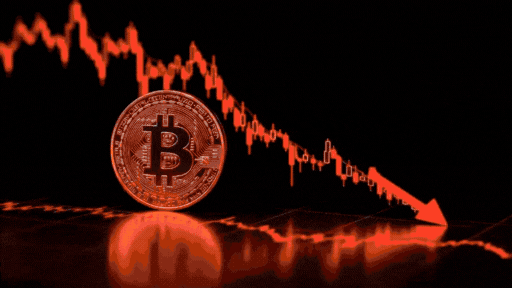
The current market correction for Bitcoin may be approaching its end, according to a DeFi Planet report referencing HTX Research. This conclusion is based on an analysis of on-chain indicators and historical cycles, which suggest Bitcoin is entering a “valuation gravity zone.” The report notes that the 2026 downturn is progressing at a faster pace compared to previous bear markets, with prices currently finding support near the costs of mining production. This market development occurs amid rising institutional interest in digital assets.
Enjoyed this piece? Bookmark DeFi Planet, explore related topics, and follow us on Twitter, LinkedIn, Facebook, Instagram, Threads and CoinMarketCap Community for seamless access to high-quality industry insights.
“Take control of your crypto portfolio with MARKETS PRO, DeFi Planet’s suite of analytics tools.”


