



























































Bitcoin closed September 2026 at $83,556, up 6.4%, its best September in history, when everyone expected the month to have gone the other way. September is Bitcoin’s worst month on average, and since 2013 every positive August has been followed by a red September; August 2026 was up 25%. The macro picture argued for a fall too, because the 10-year US Treasury yield climbed to its highest level since 2007, and when risk-free government debt pays that much, money usually leaves assets that pay nothing at all.

Despite a deepening Treasury selloff, oil above $100 a barrel, and markets pricing in further rate hikes, Bitcoin remained resilient through all of it, holding a tight $82,000 – $84,000 range for a week and a half. What held it there was a different level of buying this month: spot Bitcoin ETFs saw $2.65 billion in inflows. What changed wasn’t the macro picture, but the identity of the buyer.
Why September Was Supposed to be Bad for Bitcoin
Since 2013, September has been Bitcoin’s weakest month, averaging a 2.87% decline, with a median loss of 2.44%, according to CoinGlass. Note the distinction: the median loss reflects the middle outcome, whereas the average is skewed by extreme outlier months.
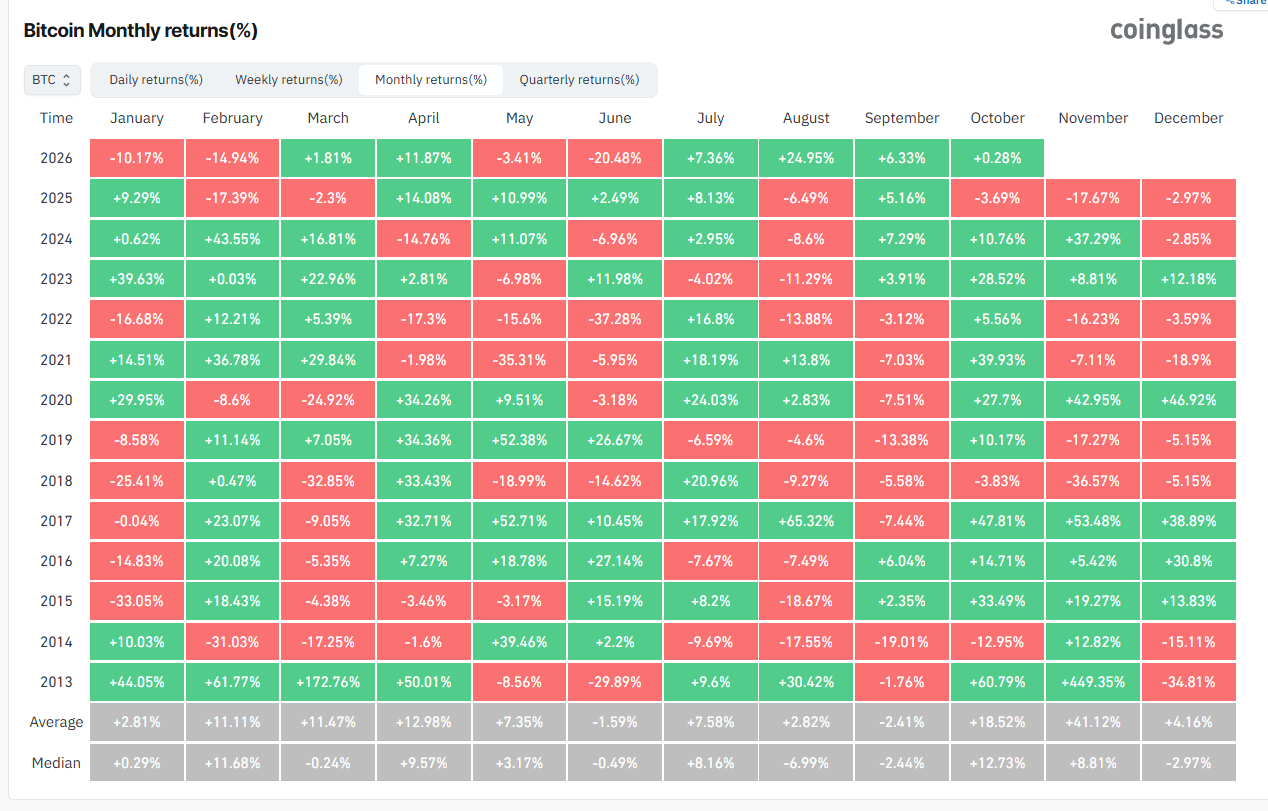
The macroeconomic bear case against Bitcoin was the strongest it has appeared in years. The 10-year Treasury rate climbed roughly 50 basis points over the month, rising from just under 4.8% in the first week to 5.29% by 29 September.
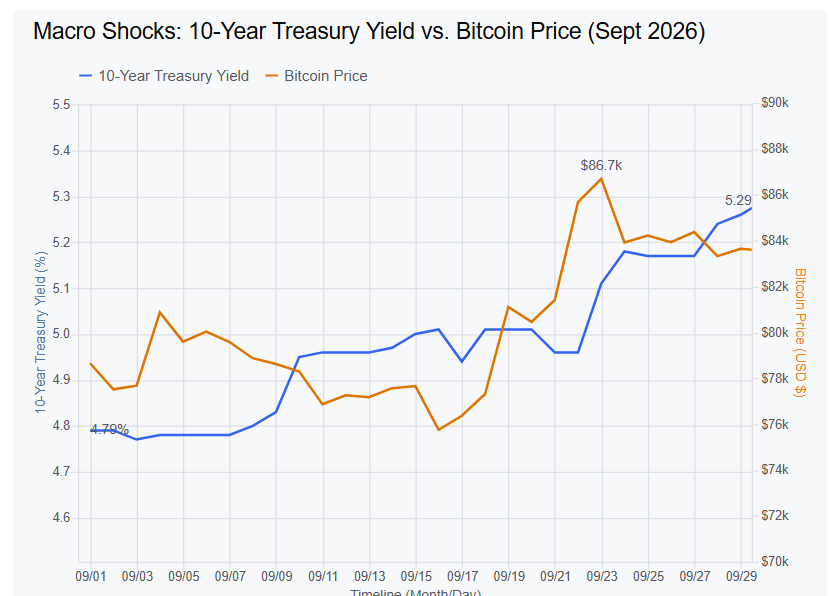
In early September, Brent crude hovered near $99 per barrel amid escalating Middle East hostilities involving Israel, Iran, regional proxy actors, and the US. These persistent energy cost pressures fed directly into broader inflation expectations and heightened global macroeconomic uncertainty at the start of the month. The University of Michigan’s year-ahead inflation expectations jumped to 4.6% in September from 4.0% in August.
The rise pushed the average 30-year fixed mortgage rate to 7.03% by late September, its highest since April 2024. The bond market was repricing everything at once, which is why Bitcoin’s refusal to follow was unusual enough to be worth explaining.
Peter Schiff spent mid-September arguing that Bitcoin had failed its digital-gold test outright. He said rising yields would pull capital toward safer assets and warned the 10-year rate could reach 6%.
Peter Schiff: “The Fed Has Already Lost The Battle Against Inflation” & BTC vs GOLD Debate
In 2022, the 10-year yield more than doubled to 3.88% as the Fed tightened aggressively, and Bitcoin fell 64% that year.
Why the Old Playbook Didn’t Apply
In financial terms, “duration” measures how sensitive an asset’s price is to changes in interest rates. When interest rates or Treasury yields rise, high-growth, long-duration tech stocks usually suffer because their future earnings become less valuable today. By breaking away from tech stocks, Bitcoin avoided the sharp sell-off that hit rate-sensitive assets, trading more like a hedge against rising yields and currency debasement rather than a risky tech investment.
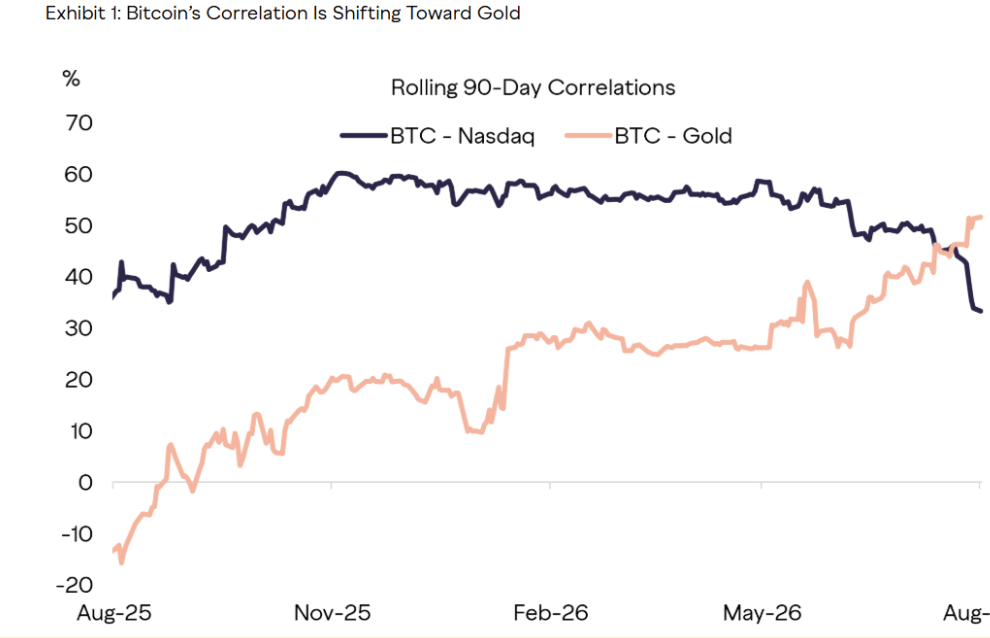
Bitcoin’s 90-day rolling correlation with the Nasdaq fell to roughly 33% from above 60% earlier in 2026, while its correlation with gold climbed above 50%, per Grayscale Research. CoinShares data put the Nasdaq correlation at its lowest since 2024.
Federal Reserve interest rate hikes generally hurt Bitcoin. However, as 10x Research founder Markus Thielen explained, when yields rise due to fiscal concerns and term premium risks rather than Fed tightening, market dynamics change. Since late 2023, 10-year Treasury yields climbed 135 basis points while Bitcoin nearly doubled, a divergence that traditional bear cases fail to account for.
READ ALSO: The Bitcoin Debate Has Moved Beyond Digital Gold
Who Was Buying While Everyone Expected Selling?
Institutional buying drove the rally, but it arrived late and in bursts rather than the steady daily inflows market consensus expected.
Spot Bitcoin ETF flows remained negative through mid-month, recording net outflows of roughly $450 million on September 15 and $296 million on September 16, according to Farside Investors. However, a powerful seven-day inflow streak beginning September 17 added approximately $6.6 billion, highlighted by a single-day print near $1 billion on September 21, marking the best daily performance since October 2025.
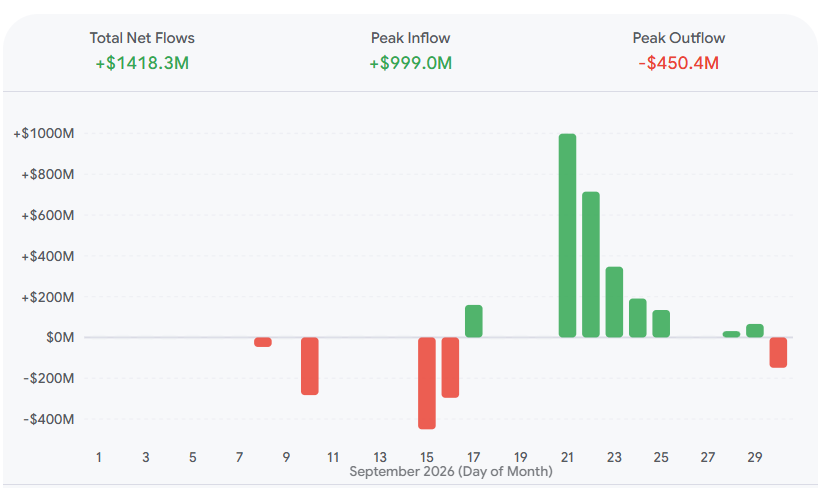
The year-to-date total turned positive on September 22 for the first time since May 26. Strategy purchased 2,615 BTC across two September transactions for $218.4 million, bringing its total holdings to 847,666 BTC acquired for approximately $63.95 billion. While significant, this total equals roughly a fifth of a single strong spot Bitcoin ETF inflow day. The firm also sold a portion of its Bitcoin in late July and early August, its first sales since adopting its treasury strategy in 2020.
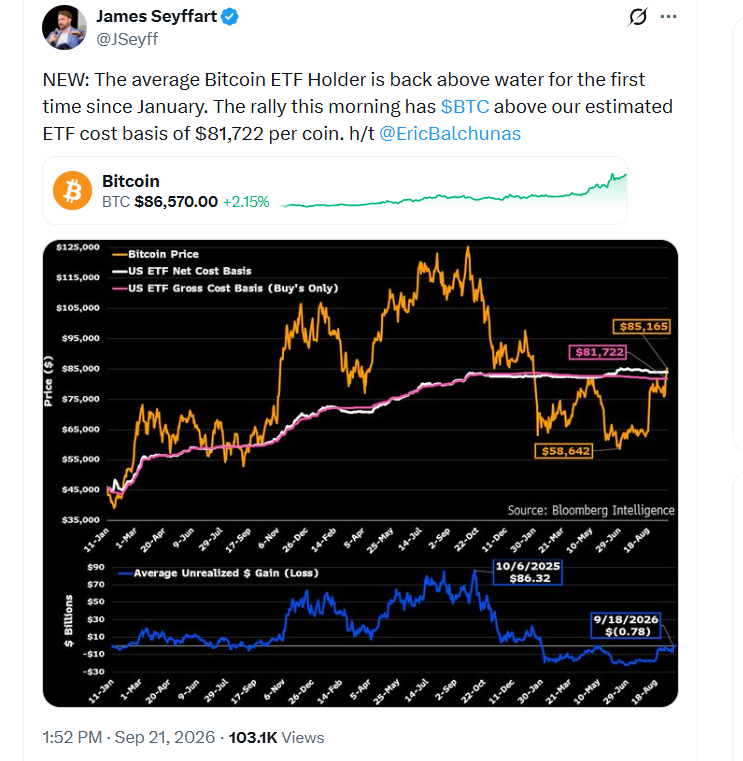
Meanwhile, Bloomberg ETF analyst James Seyffart estimated the average cost basis for ETF holders near $81,722, matching the key price level where institutional buyers repeatedly defended support.
READ ALSO: Does Bitcoin Really Need to Capture the Store-of-Value Market to Reach $1M?
Commentary and Industry Reaction
Julio Moreno, head of research at CryptoQuant, points to a hollowing-out underneath the price. Speculative futures demand collapsed roughly 90% in fifteen days, from around 164,000 BTC on September 14 to 16,000 by September 29. Recent buyers are sitting on average unrealised gains of 33%, the highest since December 2024, and on September 22 holders realised profit on about 25,700 BTC, the largest single-day total of the year. Without fresh demand, Moreno argues, rallies struggle to extend.
Sonali Gupta, research lead at AMINA Bank, sets a cleaner test than any price target. Bitcoin holding the -86,000 band while ETF flows stay positive would be evidence the September move is turning into a broader recovery; a reversal in flows alongside a sustained break below that range would weaken the case. She also flags a divergence worth watching: gold defending its technical levels while Bitcoin pulls institutional money, two assets now competing for the same job.
On the morning of the close, CEX.IO put the threshold at $83,600 for Bitcoin’s best September ever, roughly where it was trading, and asked followers whether they were looking at a record month or a correction setup. One trader called a clean close above $83,600 a tidy finish and little more.
$83,600.
That’s what Bitcoin needs to close today for its best September ever.
That’s also where it’s trading right now — in crypto’s historically worst month.
Record month or correction setup? Your thoughts.
— CEX.IO (@cex_io) September 30, 2026
Why Altcoins Didn’t Rally With Bitcoin
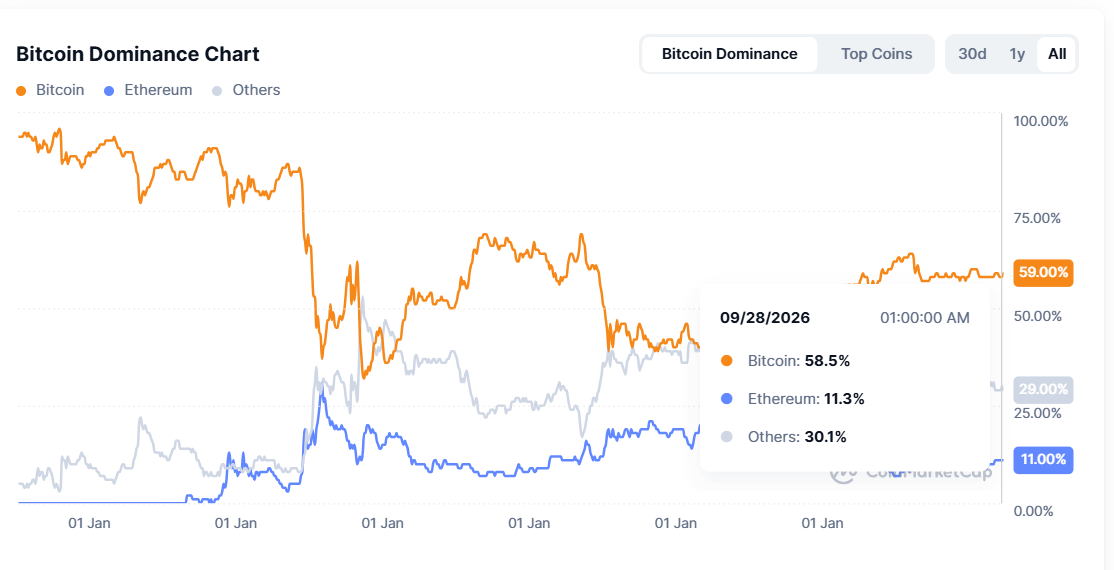
Bitcoin accounted for 58.5% of total crypto market value on 28 September, out of roughly $2.88 trillion.
CoinMarketCap’s Altcoin Season Index, which counts how many of the top 100 coins beat Bitcoin over 90 days, sat near 63, still inside Bitcoin-season territory.
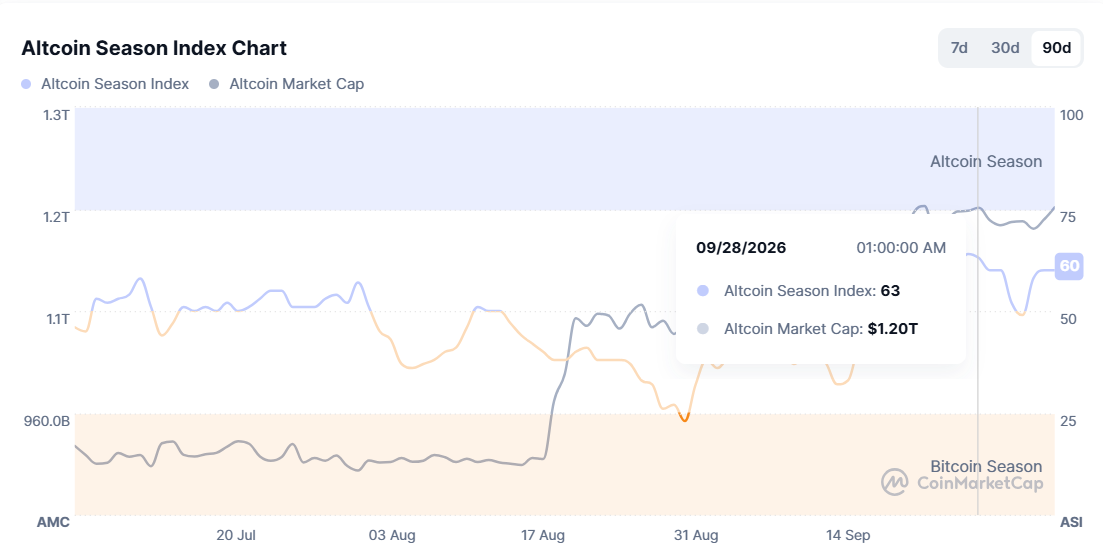
While broad market indexes show weak altcoin performance on average, capital was not completely absent; it was concentrated. Instead of a wide market rally, investment shifted selectively into specific assets: over three months, Zcash jumped roughly 295%, and Uniswap gained 248%, outperforming Bitcoin’s 44% gain.
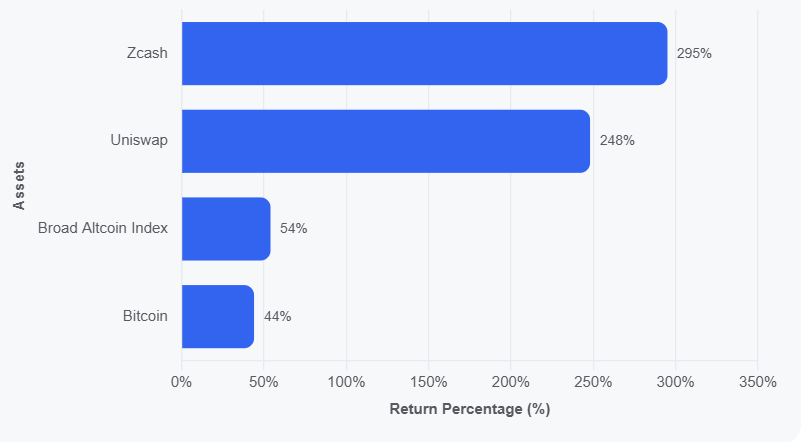
The broader altcoin market lagged behind Bitcoin due to structural supply dynamics and a significant concentration of market liquidity. A primary factor is the prevalent tokenomics model adopted by recent crypto projects, characterized by low initial circulating supply alongside high Fully Diluted Valuations (FDVs).
Under this structure, protocols launch with only a minor percentage of their total supply available on the open market, while holding substantial allocations for early investors, team members, and ecosystem treasuries subject to vesting schedules.
As these scheduled token unlocks occur, millions of dollars in new supply are systematically injected into the market each month, creating persistent overhead selling pressure that suppresses price appreciation regardless of general market sentiment.
Compounding this supply overhang is how capital is deployed during this cycle. The primary vehicle driving current market inflows, institutional spot ETFs, is structurally restricted to purchasing Bitcoin (and select major assets like Ethereum), preventing capital from naturally rotating down the risk curve into long-tail altcoins as seen in prior bull cycles.
Consequently, global market liquidity remains tightly concentrated in high-conviction, established assets with institutional access, leaving the wider altcoin sector underfunded and unable to match Bitcoin’s upward momentum.
However, some industry reviews still see hope for altcoins. Everstake, a staking infrastructure provider, closed its September review by pointing to renewed altcoin activity as a source of further strength in the broader market. Historically, when money flowed into Bitcoin, it eventually found its way down the risk curve.
Traditional markets had September. Bitcoin had something else.
Bitcoin gained 6.3% over the past five weeks, while the S&P 500 managed just +0.3% in September and gold dropped 6.5%.
As you guys may see, stocks have largely moved sideways, and gold has weakened. Bitcoin has continued to build momentum, with the broader crypto market also participating as capital rotates back into digital assets.
And the move is being supported by stronger demand across the market, including substantial inflows into U.S. spot Bitcoin ETFs during September and continued corporate accumulation, with Strategy adding another 1,665 BTC to its treasury.
Macro conditions have also become more supportive. Cooler-than-expected August inflation briefly pushed Treasury yields lower and reduced expectations for another Fed hike, creating a more favorable backdrop for risk assets. Crypto responded particularly strongly after months of weak sentiment and heavy short positioning.
Now Q4 begins with Bitcoin carrying significantly stronger momentum than either stocks or gold, while ETF demand, corporate accumulation, improving regulatory clarity, and renewed altcoin activity are adding further strength to the broader market structure.
— Everstake (@everstake_pool) October 2, 2026
Related: What Happens to Bitcoin if US Bond Yields Soar Above 5%?
What to Watch Heading into Q4
At $83,554, September was Bitcoin’s highest monthly close of 2026, above May’s $82,792 high and back above the 12-month moving average at $77,889, with the 20-month average at $87,281 now the level overhead. Analyst Quinten François framed the next test this way,
“hold at $82.8k and reclaim $87.3k, and the case for $100k gets much stronger.”
Bitcoin just printed its highest monthly close of 2026 🚨
September closed near $83.6K, above May’s high and back above the 12-month moving average.
Hold $82.8K and reclaim $87.3K next, and the case for $100K $BTC gets MUCH stronger. https://t.co/EKaWrXgOCz
— Quinten (@QuintenFrancois) October 1, 2026
The inverse matters more, because a close back below $82,800 undoes the break entirely.
| Level | Significance |
|---|---|
| $87,000–$90,000 | September high was $87,363 (21 Sept); unbroken resistance |
| $83,000–$84,000 | Late-September trading range |
| ~$81,700 | ETF holders’ average cost basis |
| $75,000 | September expiry max pain |
Futures open interest has climbed back toward $60 billion after spending June and July in the mid-$40 billion range, while options open interest pushed above $50 billion, its highest since late 2025 and sharply above roughly $25 billion in late June.
Thielen’s case for 6% rests on arithmetic rather than sentiment: the 10-year yield sits near 5.24% against nominal GDP growth of about 6.56%, while federal debt has grown roughly 8.5% a year since 2020. On that gap, he argues the yield still has room to run, which, on his own framework, is not automatically bearish for Bitcoin.
If ETF creations hold near the late-September pace and Bitcoin reclaims $87,000, the next key resistance level sits at $90,000. Conversely, if inflows slow while derivatives open interest remains elevated, the accumulated leverage could unwind rapidly, putting $81,700 back in focus. October’s historical average return of about 19.92% relies on limited historical data and should not be viewed as a guarantee.
One further caution: Bitcoin remains roughly 4.4% below its 2026 starting price of about $87,497 and well below its all-time high of $126,210.50. A strong September is actually not a recovered market.
September’s outcome provides quite a nuanced signal because Bitcoin’s performance was largely sustained by persistent institutional ETF demand rather than broader retail participation. Whether these institutional flows persist into the fourth quarter remains the critical factor for market direction.
Disclaimer: This article is intended solely for informational purposes and should not be considered trading or investment advice. Nothing herein should be construed as financial, legal, or tax advice. Trading or investing in cryptocurrencies carries a considerable risk of financial loss. Always conduct due diligence.
Enjoyed this? Bookmark DeFi Planet, explore related topics, and follow us on Twitter, LinkedIn, Facebook, Instagram, Threads, and CoinMarketCap Community for seamless access to high-quality industry insights.
Take control of your crypto portfolio with DEFI PLANET PRO, DeFi Planet’s suite of analytics tools.