


The crypto ended February with a whirlwind of price movements. While some assets struggled with losses due to market pressures, others surged on the back of favourable trends and institutional activity. Here’s a breakdown of last month’s top seven gainers and losers, as well as their outlook for March.

Top 7 Gainers
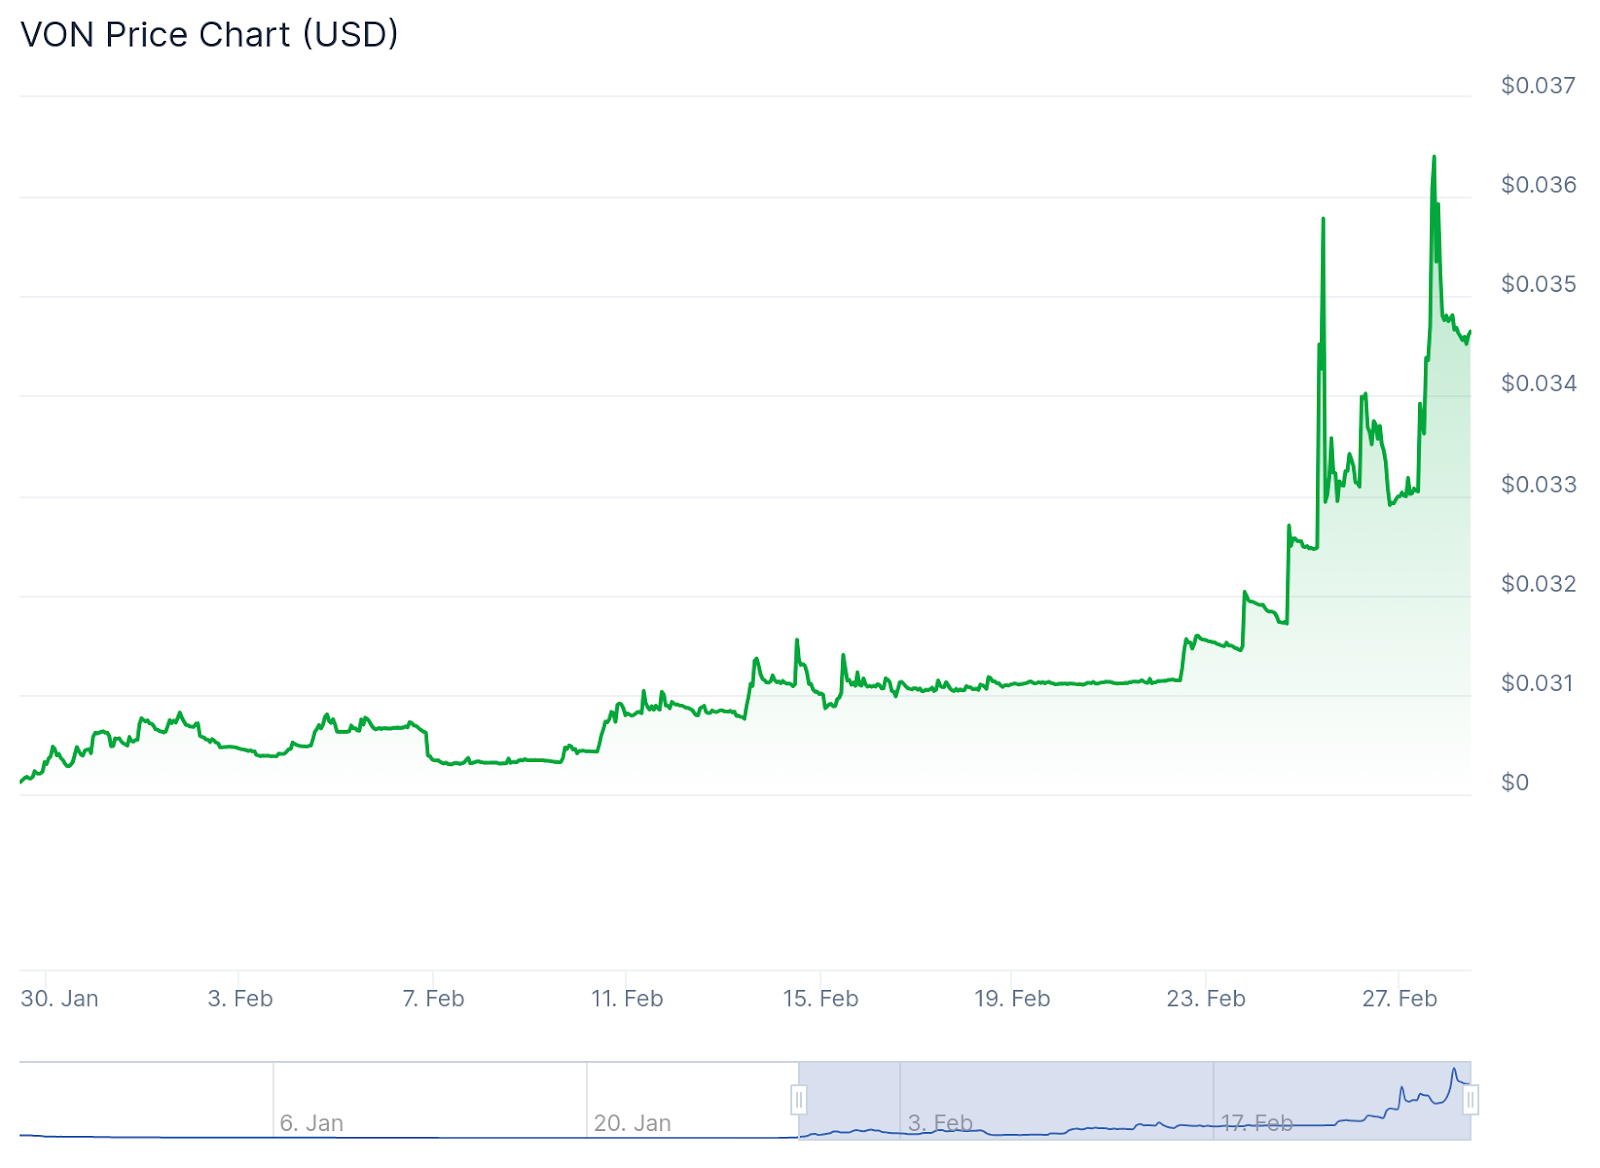
VON (VON) | +6899.1%
VON led February’s gains with a staggering 6899.1% surge, likely driven by speculative trading and community hype. With its market cap soaring from $663K (January 28) to a peak of $78.6M (February 26), investor confidence appears strong. However, the absence of a clear fundamental catalyst raises concerns about sustainability.
- Bullish case: If volume increases, VON could break past $0.00033 and push toward $0.00040, fueled by partnerships or whale accumulation.
- Bearish case: A decline in volume may trigger a correction to $0.00025 or even $0.00020, signaling a trend reversal if the market cap drops below $60M.
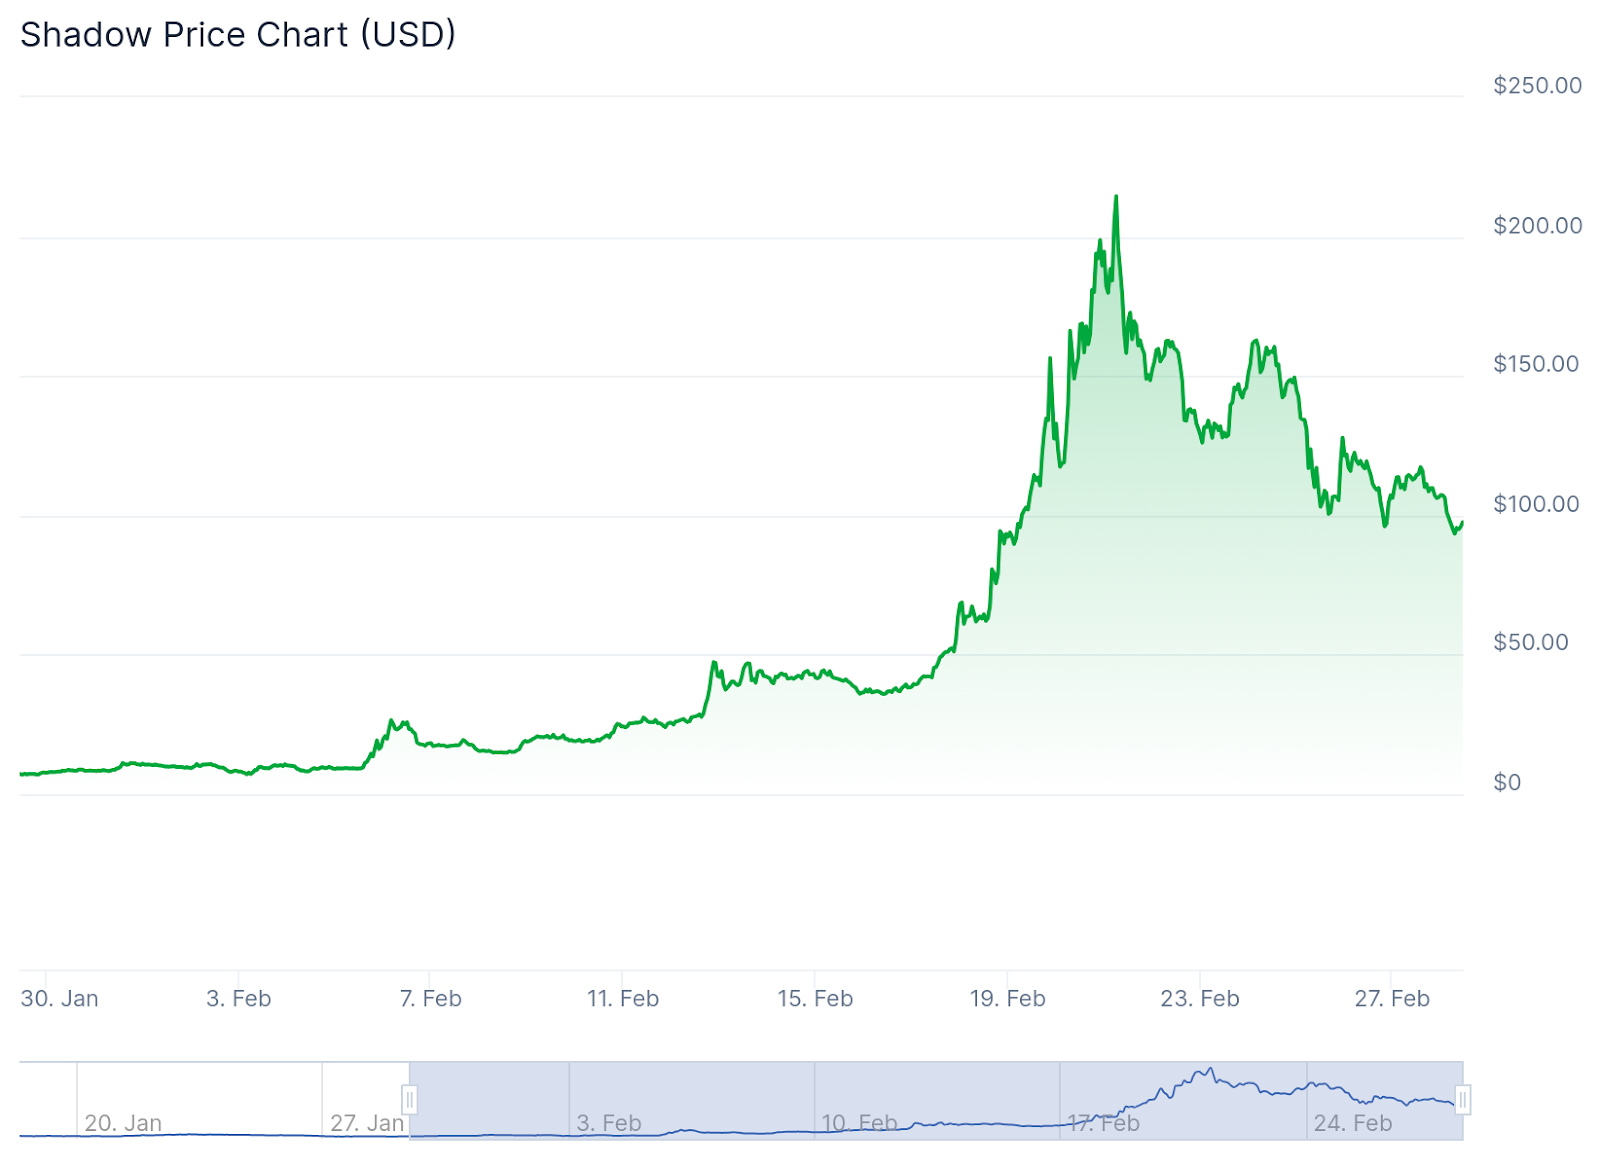
Shadow (SHADOW) | +1554.3%
SHADOW saw a 1554.3% gain, peaking at $183.15 on February 20 before correcting to $107.41 by month-end. Its extreme volatility suggests either strong hype, a major event, or whale manipulation.
- Bullish case: If support holds, SHADOW could stabilize between $120-$140.
- Bearish case: Continued volume decline could push the price below $100, with large holders taking profits.
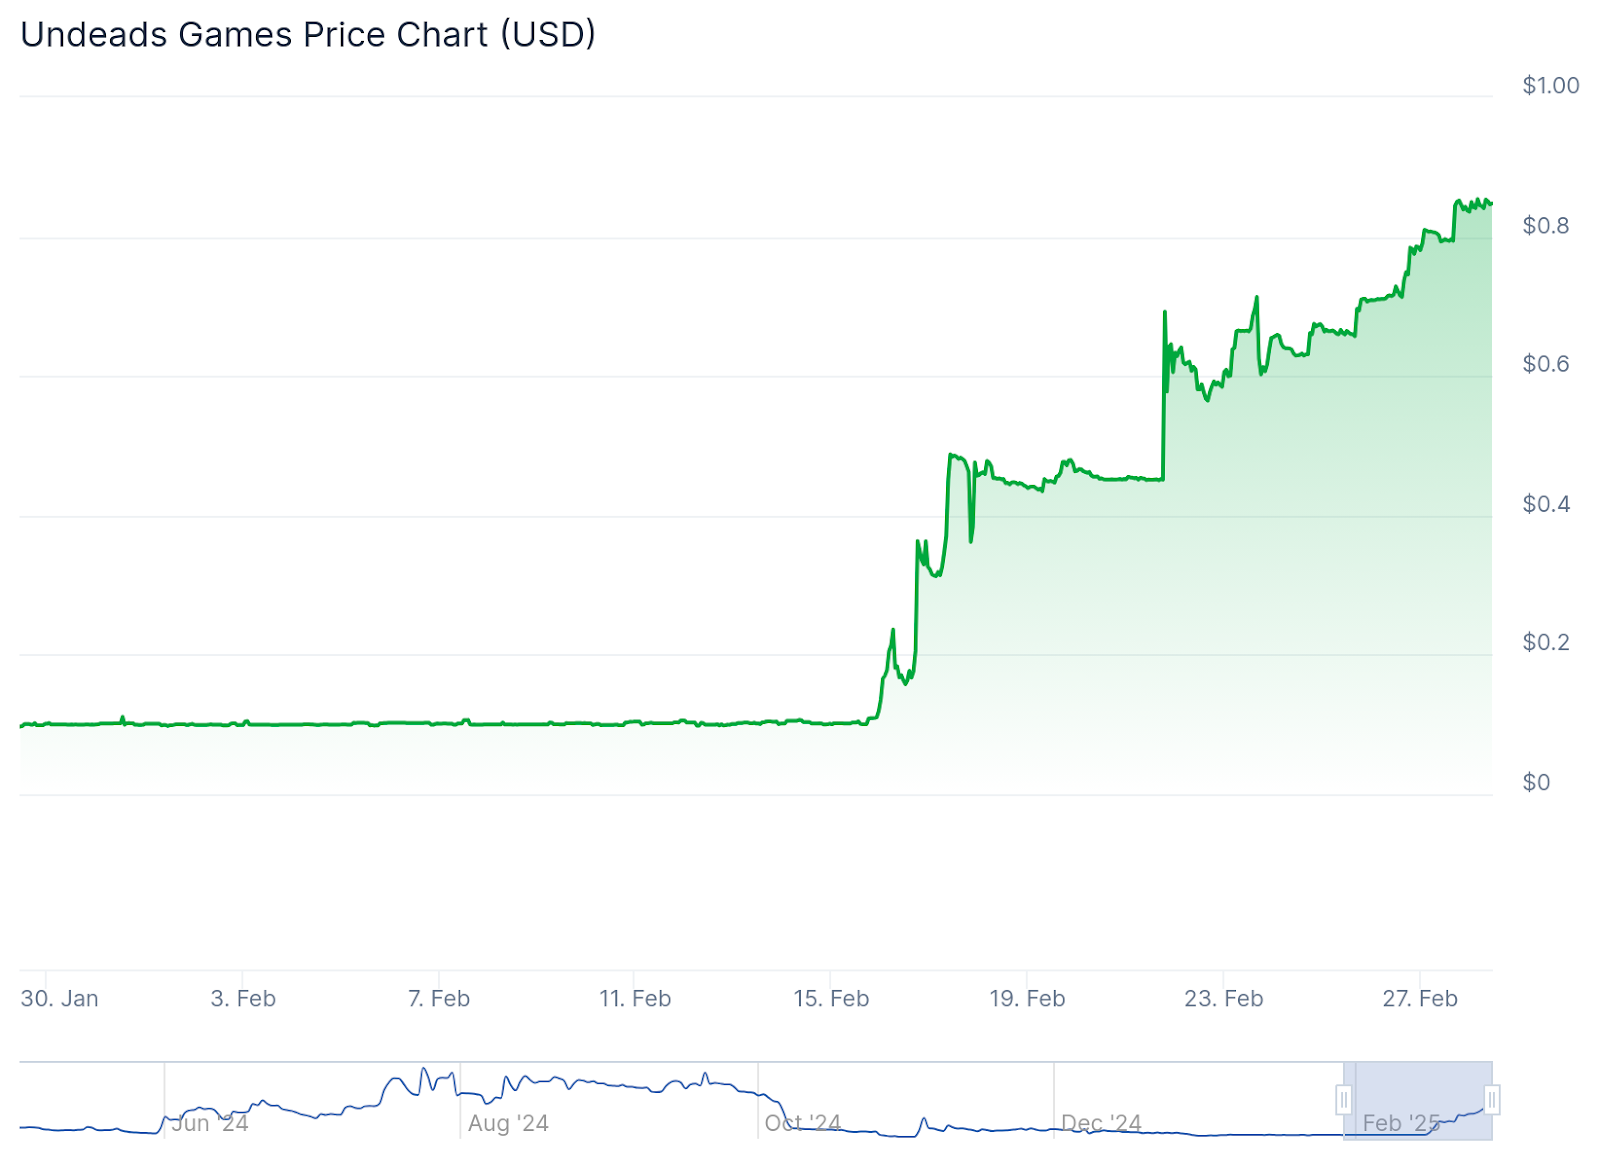
Undeads Games (UDS) | +731.7%
UDS benefited from renewed interest in gaming tokens, surging from $0.101249 to $0.852001 in February. The strongest breakout occurred on February 17, with a 46% single-day gain.
- Bullish case: If investor interest holds, UDS could consolidate between $0.70 and $0.85.
- Bearish case: Profit-taking may lead to a retracement toward $0.60 or lower.
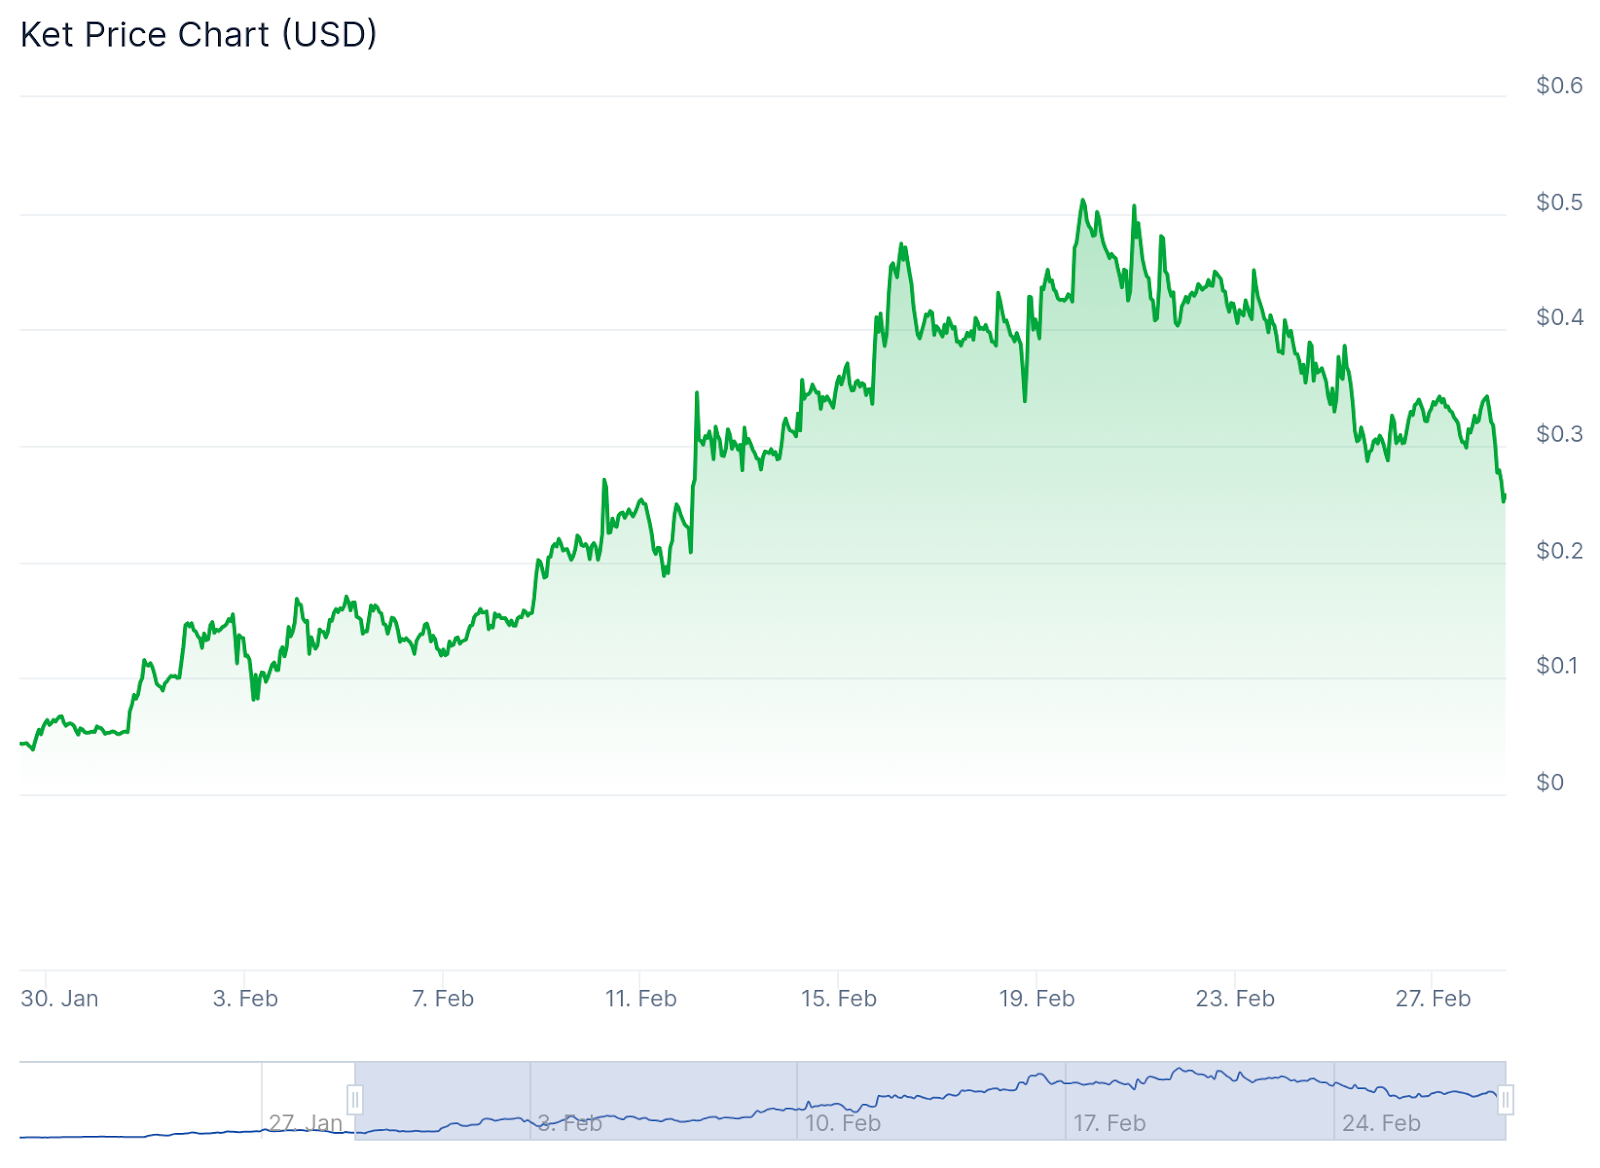
Ket (KET) | +563.3%
KET’s rally, supported by a $13.7M trading volume, suggests institutional or whale accumulation. The market cap jumped from $40.97M to $340.94M in February, with steady gains throughout the month.
- Bullish case: If liquidity remains strong, further gains are possible.
- Bearish case: A lack of continued momentum could lead to a pullback.
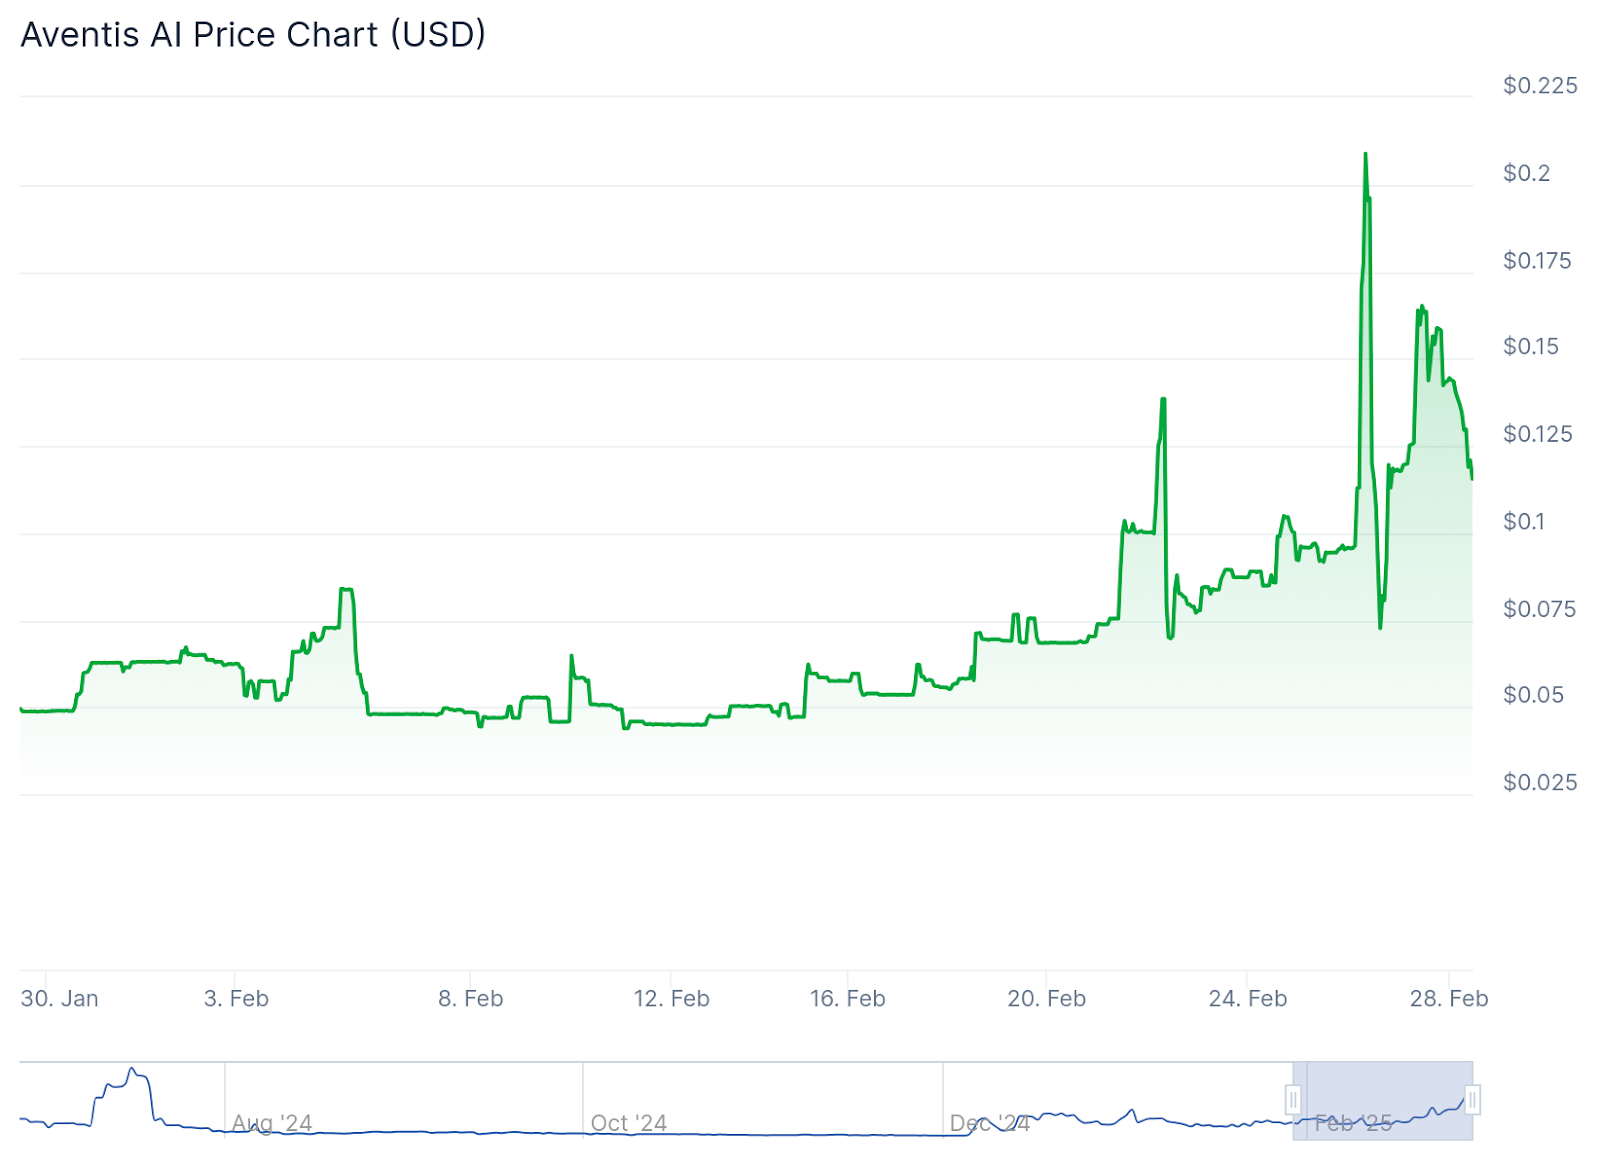
Aventis AI (AAI) | +215.1%
Riding the AI boom, AAI surged from $0.052935 to $0.143878 in February, reflecting strong investor interest. Market cap growth from $20.53M to $55.83M suggests institutional entry.
- Bullish case: Further adoption in AI-driven blockchain applications could drive price appreciation.
- Bearish case: If hype fades, price could dip below $0.10.
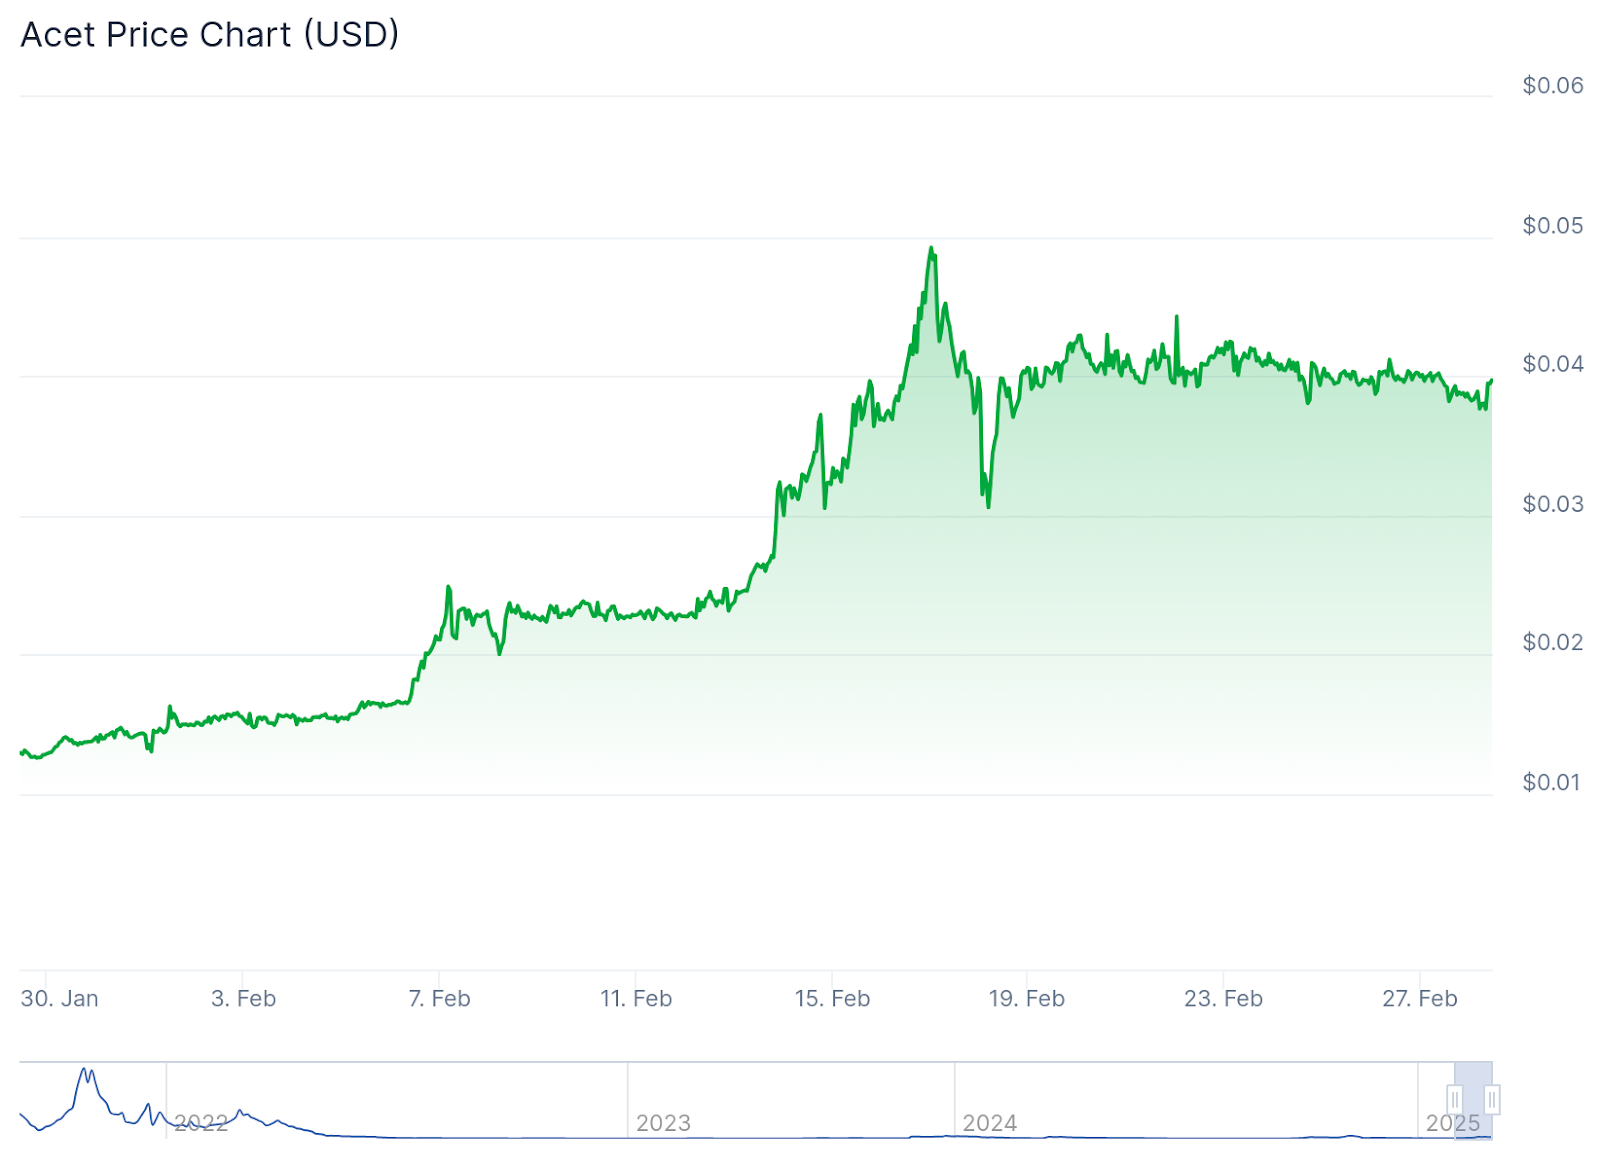
Acet (ACT) | +161.3%
Acet (ACT) experienced a 161.3% increase in February, with its price rising from $0.0154 (February 5) to $0.0475 (February 16) before closing the month with $0.0402. The surge in market cap from $33.89M to $83.32M suggests strong investor interest, likely fueled by increasing adoption.
Bullish Case:
- The steady rise in price and market cap indicates growing investor confidence.
- If trading volume surpasses $1M, ACT could break past $0.0425 and aim for $0.045..
Bearish Case:
- A drop in trading volume could see the token retest $0.035 or even $0.032, particularly if broader market sentiment weakens.
- If the market cap falls below $75M, a correction toward $0.030 may occur, signaling a potential shift in trend.
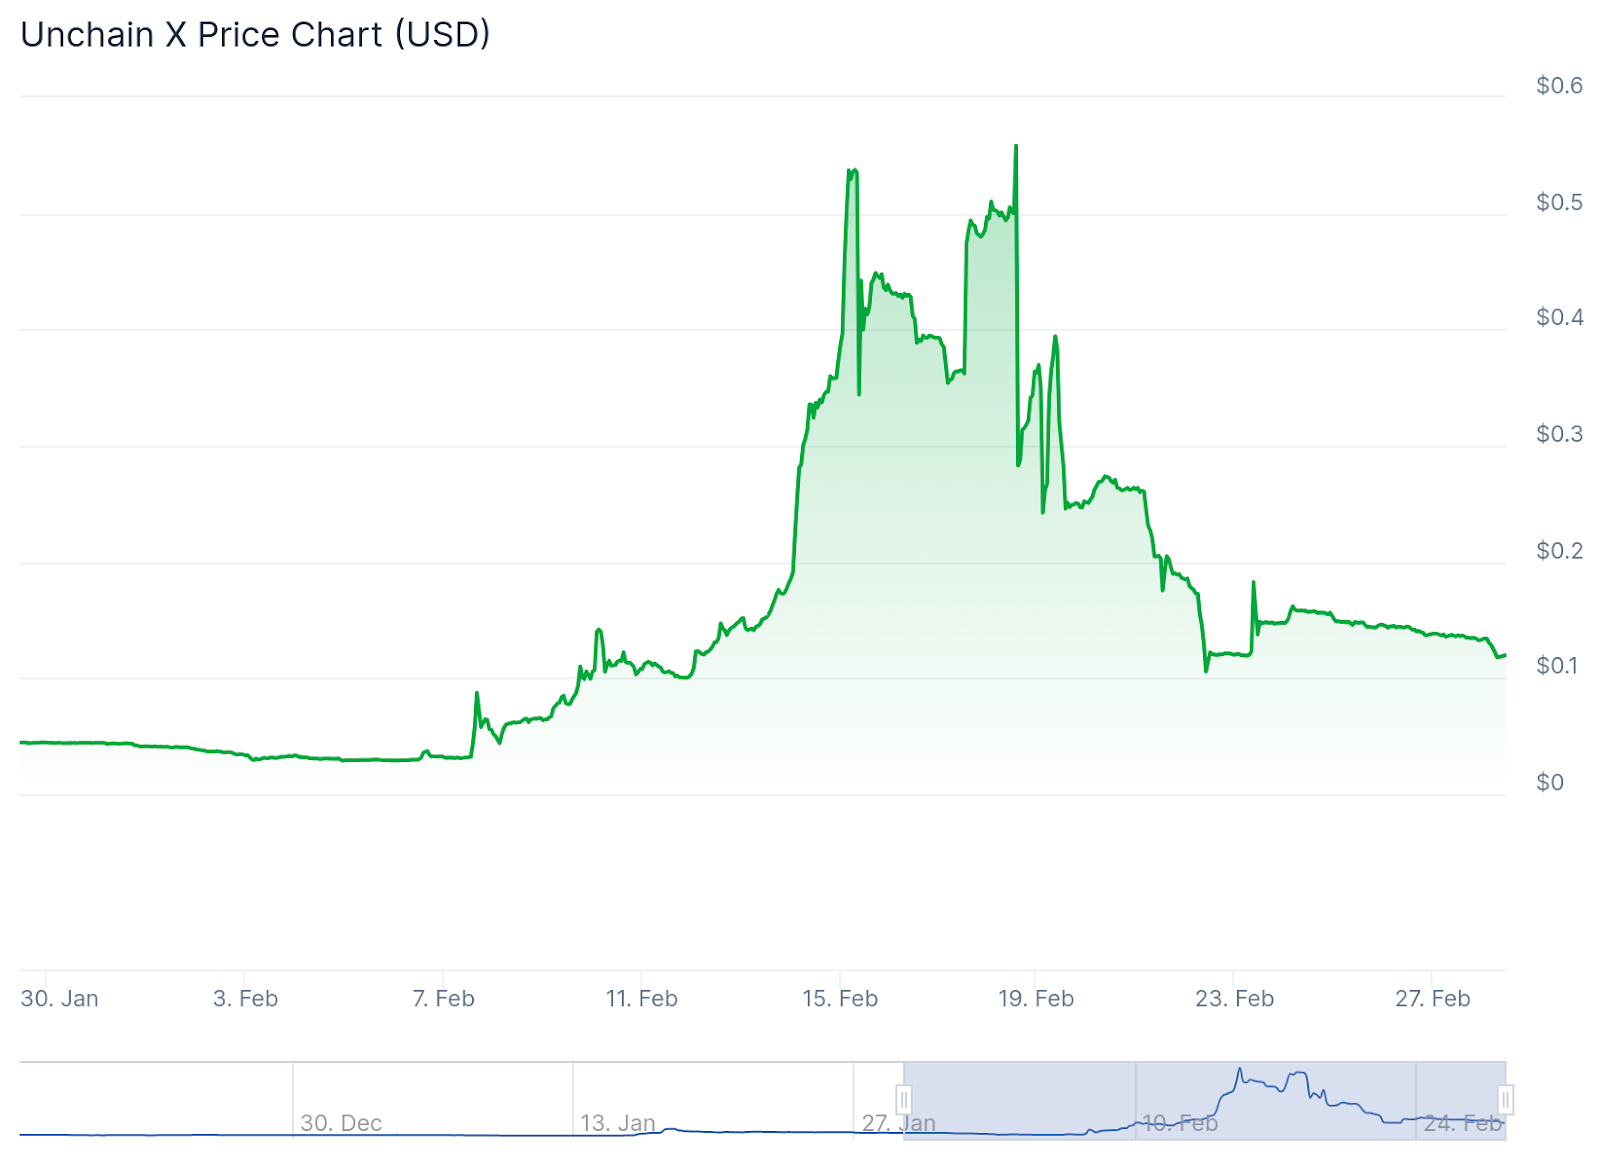
Unchain X (UNX) | +337.2%
Unchain Token (UNX) saw an impressive 337.2% surge in February, rising from $0.0293 (February 5) to $0.1278 (February 28). Market cap also grew significantly from $5.11M to $28.15M, indicating heightened investor interest and liquidity.
Bullish Case:
- Sustained volume above $500K could push UNX toward $0.15, with potential for further gains if institutional investors or whales accumulate.
- If momentum continues, breaking $0.16-$0.18 remains a possibility, especially if there are positive ecosystem developments.
Bearish Case:
- A drop in volume or market cap below $25M may see UNX correct to $0.12 or even $0.10, aligning with prior support levels.
- Market sentiment remains key – if broader market conditions turn bearish, a retracement toward $0.09-$0.08 could materialize.
Top 7 Losers
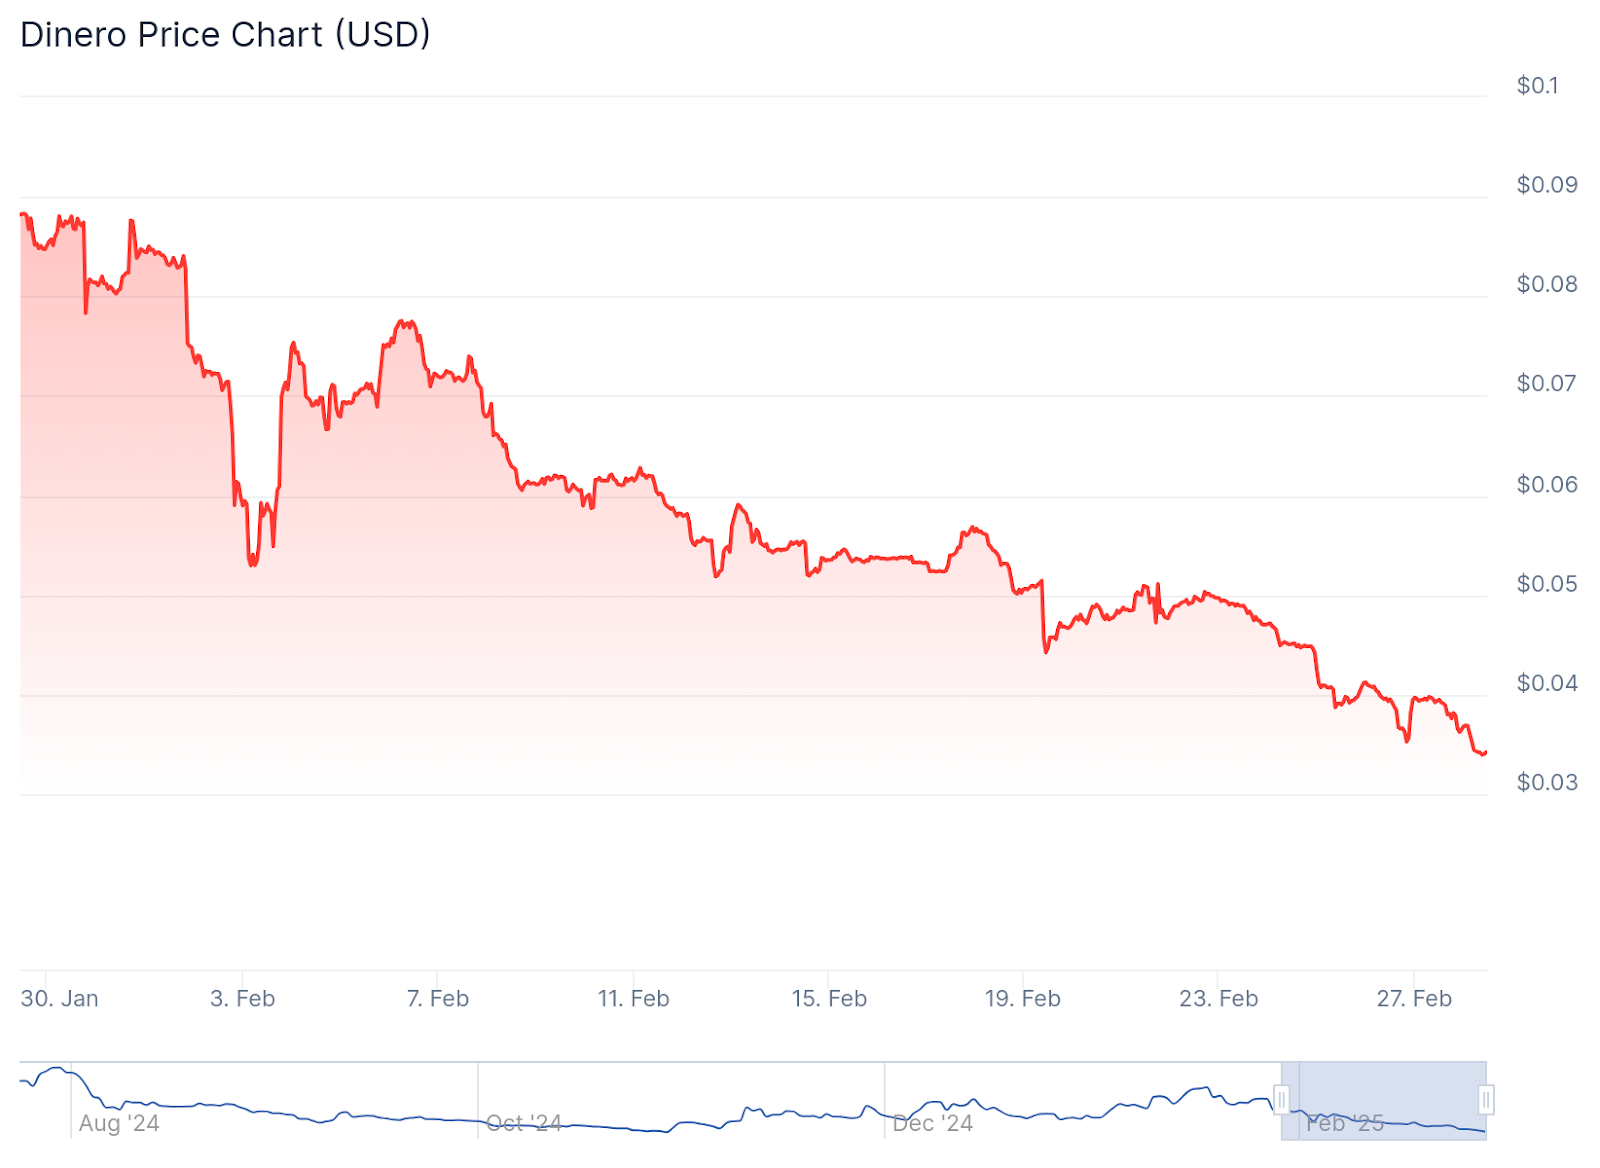
Dinero (DINERO) | -46.7%
Dinero USD (DINERO) had a challenging February, dropping 46.7% from $0.0691 (February 5) to $0.0369 (February 28). Market cap followed suit, falling from $45.1M to $24.3M, signaling capital outflows and reduced investor confidence.
Bearish Case:
- Sustained price weakness below $0.04 could push DINERO down to $0.035 or lower, especially if volume stays low.
- A decline in market cap below $23M might indicate further selling pressure, increasing the likelihood of a dip toward $0.03.
- If broader market conditions turn bearish, a correction to $0.028-$0.025 could come into play.
Potential Recovery:
- Holding above $0.04 with an uptick in trading volume (back above $500K daily) could indicate stabilization.
- If bulls reclaim $0.045-$0.05, DINERO may attempt a breakout toward $0.06, a key resistance level.
- A reversal in sentiment, possibly due to new developments or ecosystem growth, could restore confidence and drive a rebound.
Despite February’s decline, DINERO’s future trajectory depends on whether it can regain buyer interest and liquidity. Watching trading volume and market cap stability will be key in assessing recovery potential.
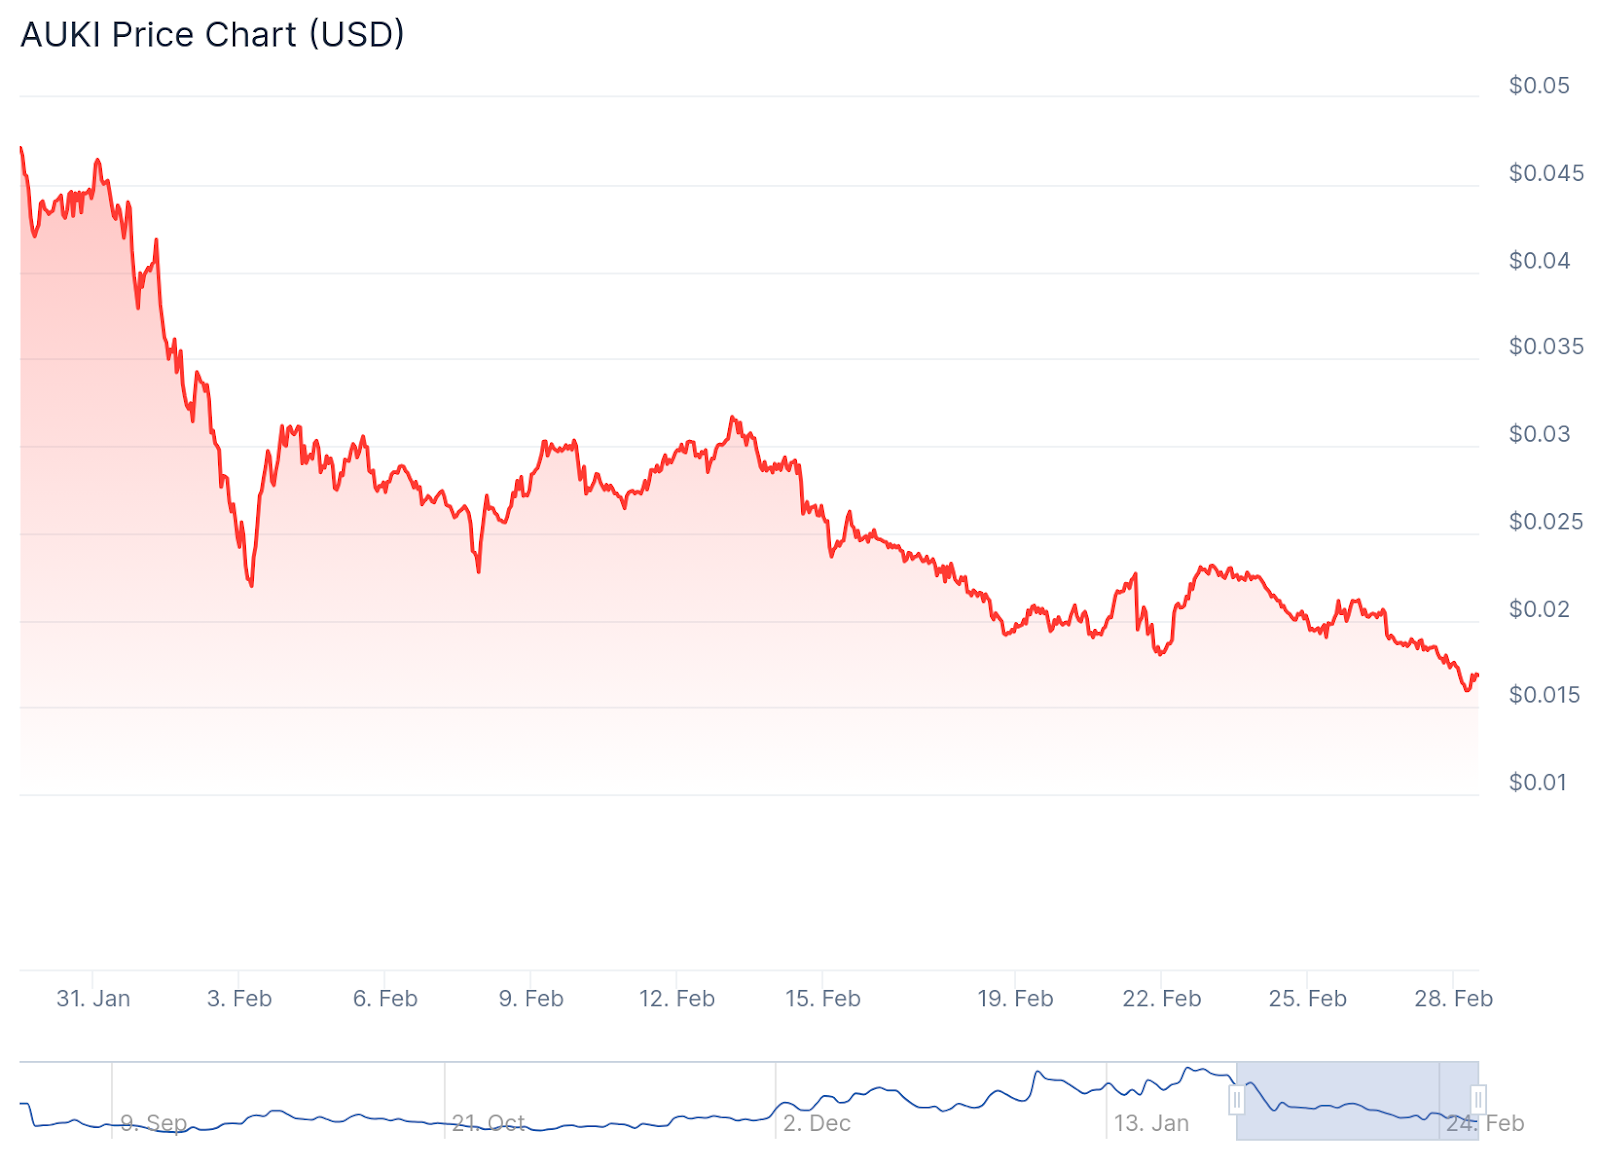
AUKI (AUKI) | -37.5%
Auki USD (AUKI) also had it tough last month, declining 37.5% from $0.0278 (February 5) to $0.0173 (February 28). Market cap also shrank from $39.56M to $25.36M, indicating reduced demand and investor outflows.
Bearish Case:
- Continued price weakness below $0.017 could open the door for a decline toward $0.015-$0.014, especially if market cap drops below $24M.
- AUKI’s low trading volume suggests reduced interest, increasing the likelihood of further downside if buyers fail to step in.
- If market sentiment remains bearish, a breakdown to $0.013-$0.012 could be on the horizon.
Potential Recovery:
- Holding above $0.018 with a volume boost (back to $200K+) could indicate a stabilization phase.
- A push toward $0.02-$0.022 would suggest a potential trend reversal, especially if demand strengthens.
- If bulls regain control, $0.025+ could become achievable, marking a return to mid-February levels.
Despite February’s steep decline, AUKI’s long-term recovery hinges on buying momentum and ecosystem growth. Investors should monitor market cap trends and liquidity before making any moves.
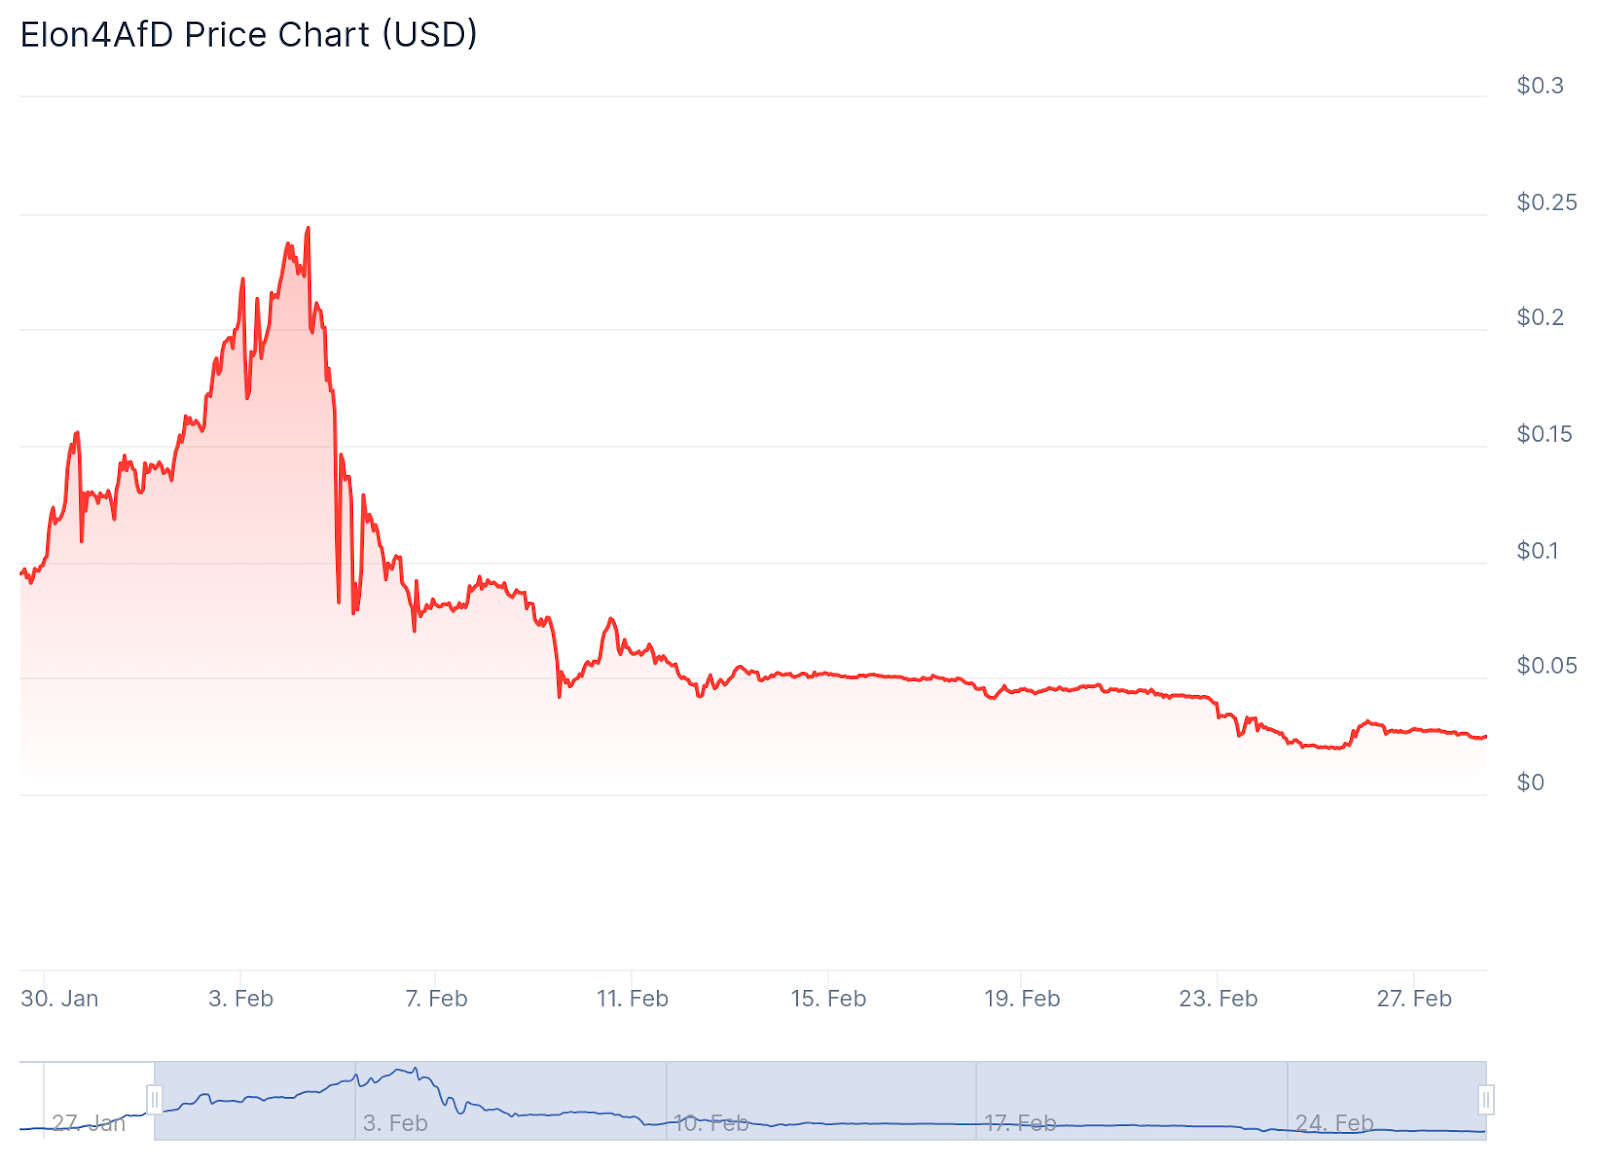
Elon4AfD (ELON4AFD) | -81.9%
Also falling 81.9% over the past 30 days, Elon4AfD has suffered from fading hype and reduced community engagement. Market analysts note that meme coins often experience extreme volatility, and ELON4AFD appears to be following this trend. It experienced a significant decline of 81.9% in February, dropping from $0.14496 (February 5) to $0.02622 (February 28). Market cap also saw a sharp reduction from $144.96M to $26.22M, reflecting a major sell-off and decreased investor confidence.
Bearish Case:
- Continued price weakness below $0.025 could push XYZ toward $0.020 or lower, particularly if market cap fails to recover.
- Trading volume has significantly declined from early February levels, indicating reduced liquidity and lower investor participation.
- If downward momentum persists, a retest of February lows around $0.020-$0.018 is possible.
Potential Recovery:
- A strong bounce above $0.027 with increased volume could indicate early signs of a reversal.
- Sustaining above $0.030 would be crucial for recovery, with a potential move toward $0.035-$0.040 if demand strengthens.
- A return of market cap above $30M+ would suggest renewed investor interest and improved sentiment.
Elon4AfD’s performance in February was marked by high volatility and heavy selling pressure. Recovery will depend on market sentiment, liquidity, and renewed buying interest in the coming weeks.
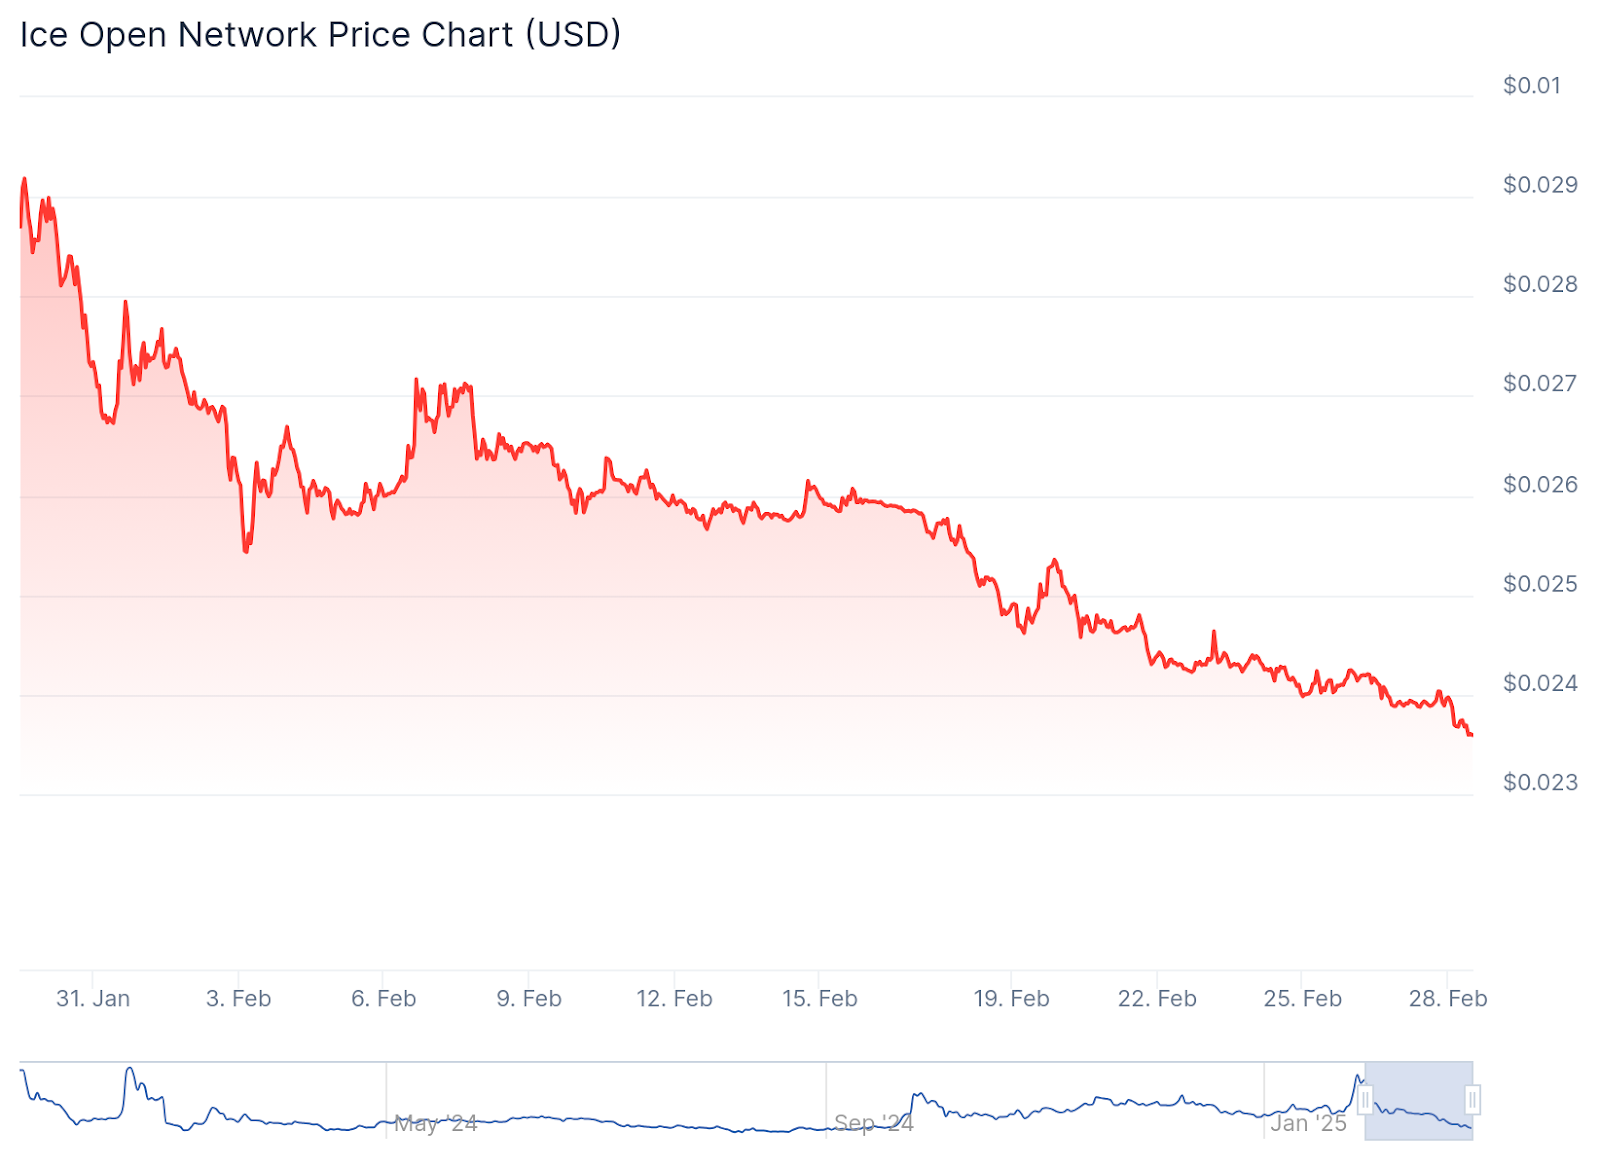
Ice Open Network (ICE) | -33.6%
Ice Open Network (ICE) recorded a 33.6% decline in February, dropping from $0.00595 (February 5) to $0.00395 (February 28). The market cap also fell from $40.3M to $26.9M, signaling weaker demand and potential sell-offs.
Bearish Case:
- ICE has been on a downward trend, with prices struggling to hold above $0.004.
- A further decline below $0.0038 could see ICE retesting $0.0035-$0.0032, aligning with previous support zones.
- Market cap erosion suggests weakening investor confidence, and a continued drop could lead to lower liquidity and increased volatility.
Potential Recovery
- A reclaim of $0.0042 with strong trading volume could indicate a short-term reversal.
- Sustaining above $0.0045-$0.0047 may help ICE regain momentum, with a potential push toward $0.0050.
- A return of market cap above $30M+ would be a positive signal for renewed buying interest.
February was marked by selling pressure and lower price stability for ICE. A potential rebound depends on trading volume, broader market sentiment, and renewed investor participation in the coming weeks.
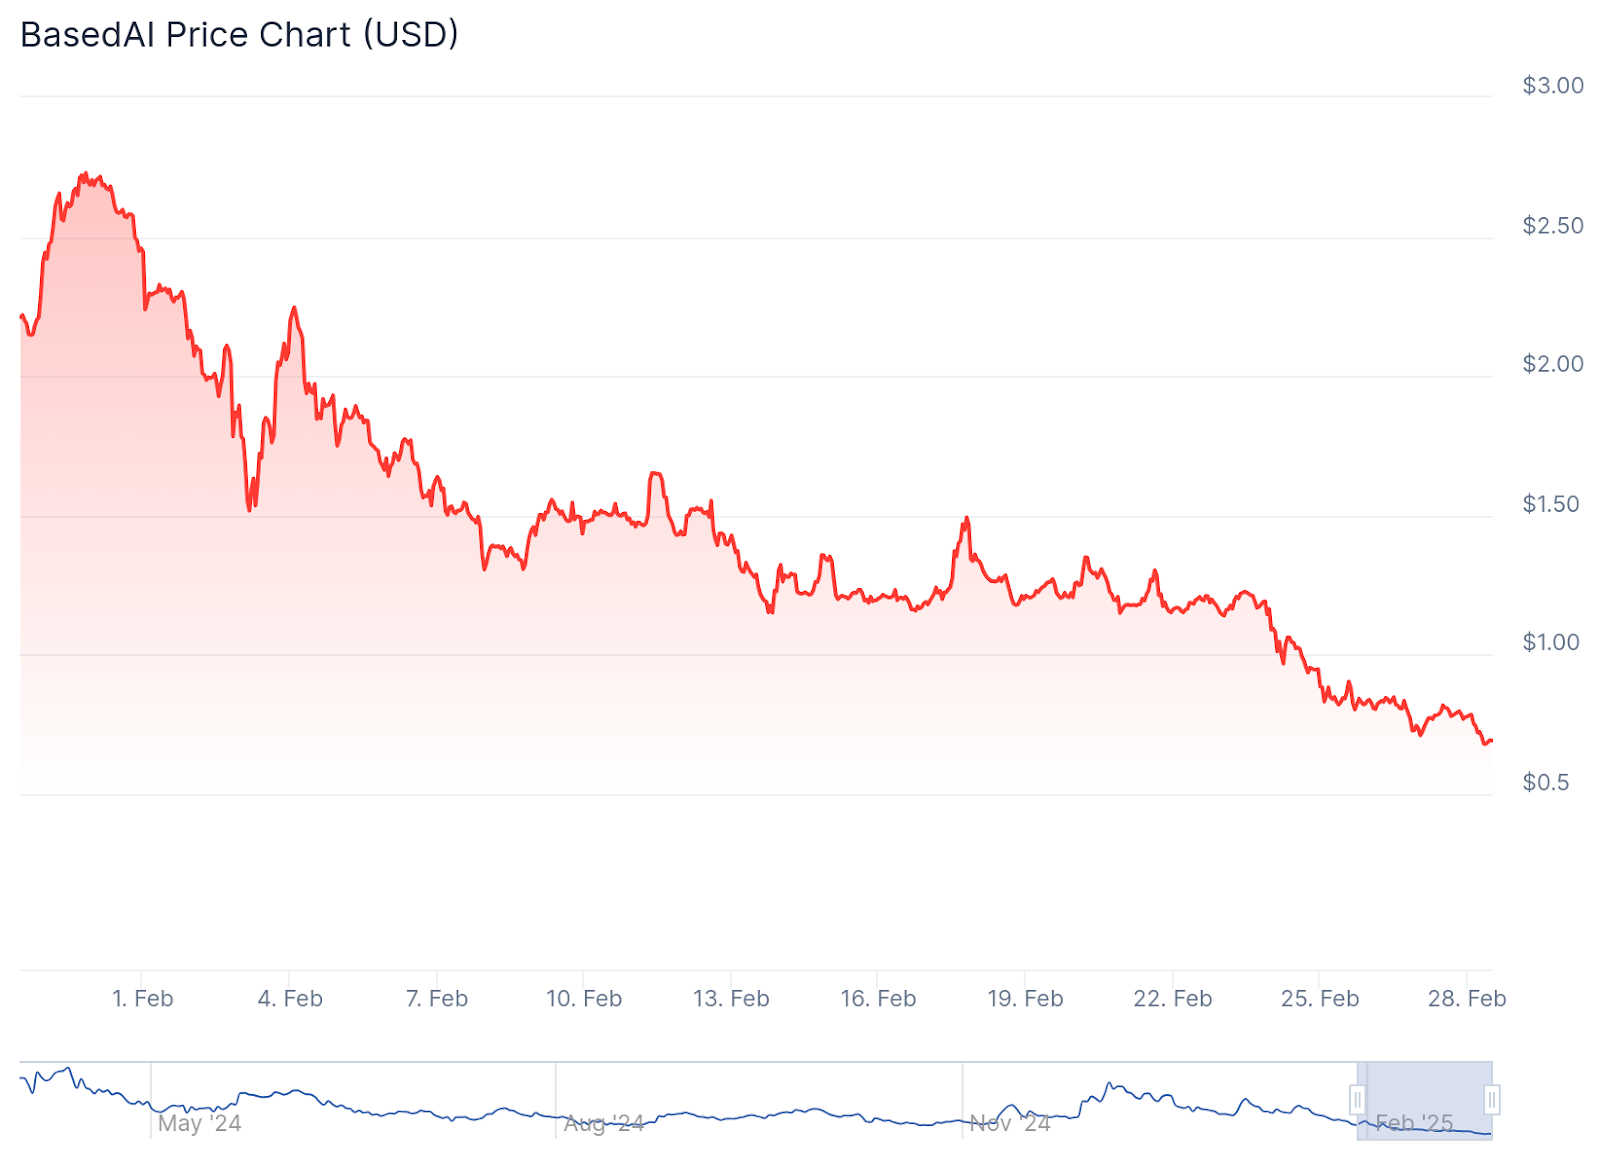
BasedAI (BASEDAI) | -57.1%
BasedAI (BASEDAI) experienced a 57.1% decline in February, falling from $1.83 (February 5) to $0.784 (February 28). The market cap also dropped from $64.6M to $28M, indicating a significant reduction in investor confidence and trading activity.
Bearish Case:
- The price has consistently dropped since mid-February, breaking key support levels at $1.50, $1.25, and $1.00.
- The market cap has been shrinking, indicating capital outflows and reduced investor participation.
- If the price fails to hold above $0.75, BasedAI may test $0.70-$0.65, further reinforcing bearish momentum.
Potential Recovery:
- A strong push above $0.80-$0.85 with increased trading volume could indicate a trend reversal.
- Reclaiming $1.00 would be a crucial milestone, signaling renewed investor confidence.
- A rise in market cap back above $35M-$40M could indicate increasing demand and support higher valuations.
February was a turbulent month for BasedAI, marked by heavy losses and declining investor sentiment. Whether the token stabilizes or continues its downtrend will depend on market demand, trading volume, and broader AI-sector interest in the coming weeks.
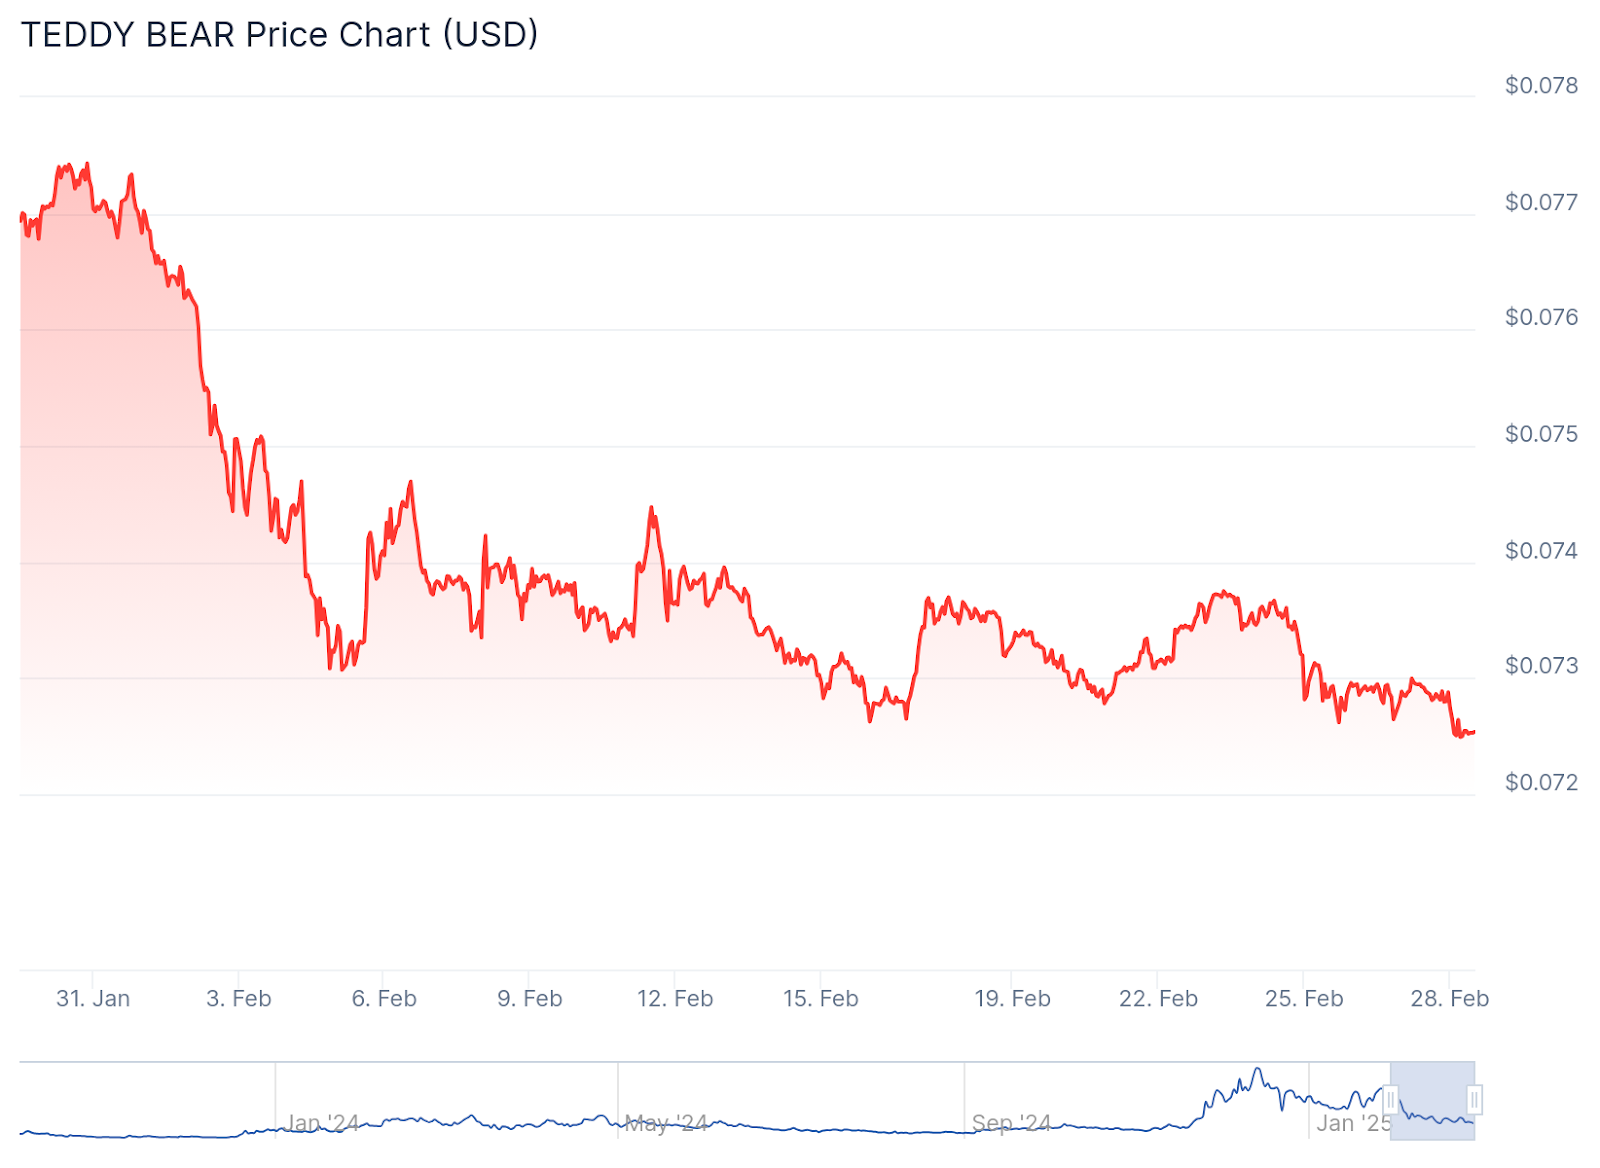
Teddy Bear (BEAR) | -39.3%
BEAR’s 39.3% decline reflects falling meme coin enthusiasm and reduced trading activity. Teddy Bear USD (BEAR) saw a 39.3% decline in February, dropping from $0.000000043954 (February 5) to $0.000000026683 (February 28). The market cap also fell from $44.1M to $26.5M, reflecting a loss in investor confidence and trading volume.
Bearish Indicators:
- The price has consistently declined from mid-February, breaking key support levels at $0.000000040, $0.000000035, and $0.000000030.
- Trading volume has remained relatively low compared to earlier in the month, indicating reduced market participation.
- If BEAR fails to hold $0.000000026, it could test $0.000000025-$0.000000023, reinforcing further downside risks.
Potential for Reversal:
- A breakout above $0.000000030 could indicate renewed interest and a possible recovery.
- Reclaiming the $0.000000035-$0.000000040 range would signal stronger demand.
- An increase in trading volume, especially above $1M daily, could indicate a shift in sentiment.
BEAR had a challenging February, with consistent price declines and shrinking market cap. A reversal will depend on trading volume, investor sentiment, and broader market trends in the coming weeks.
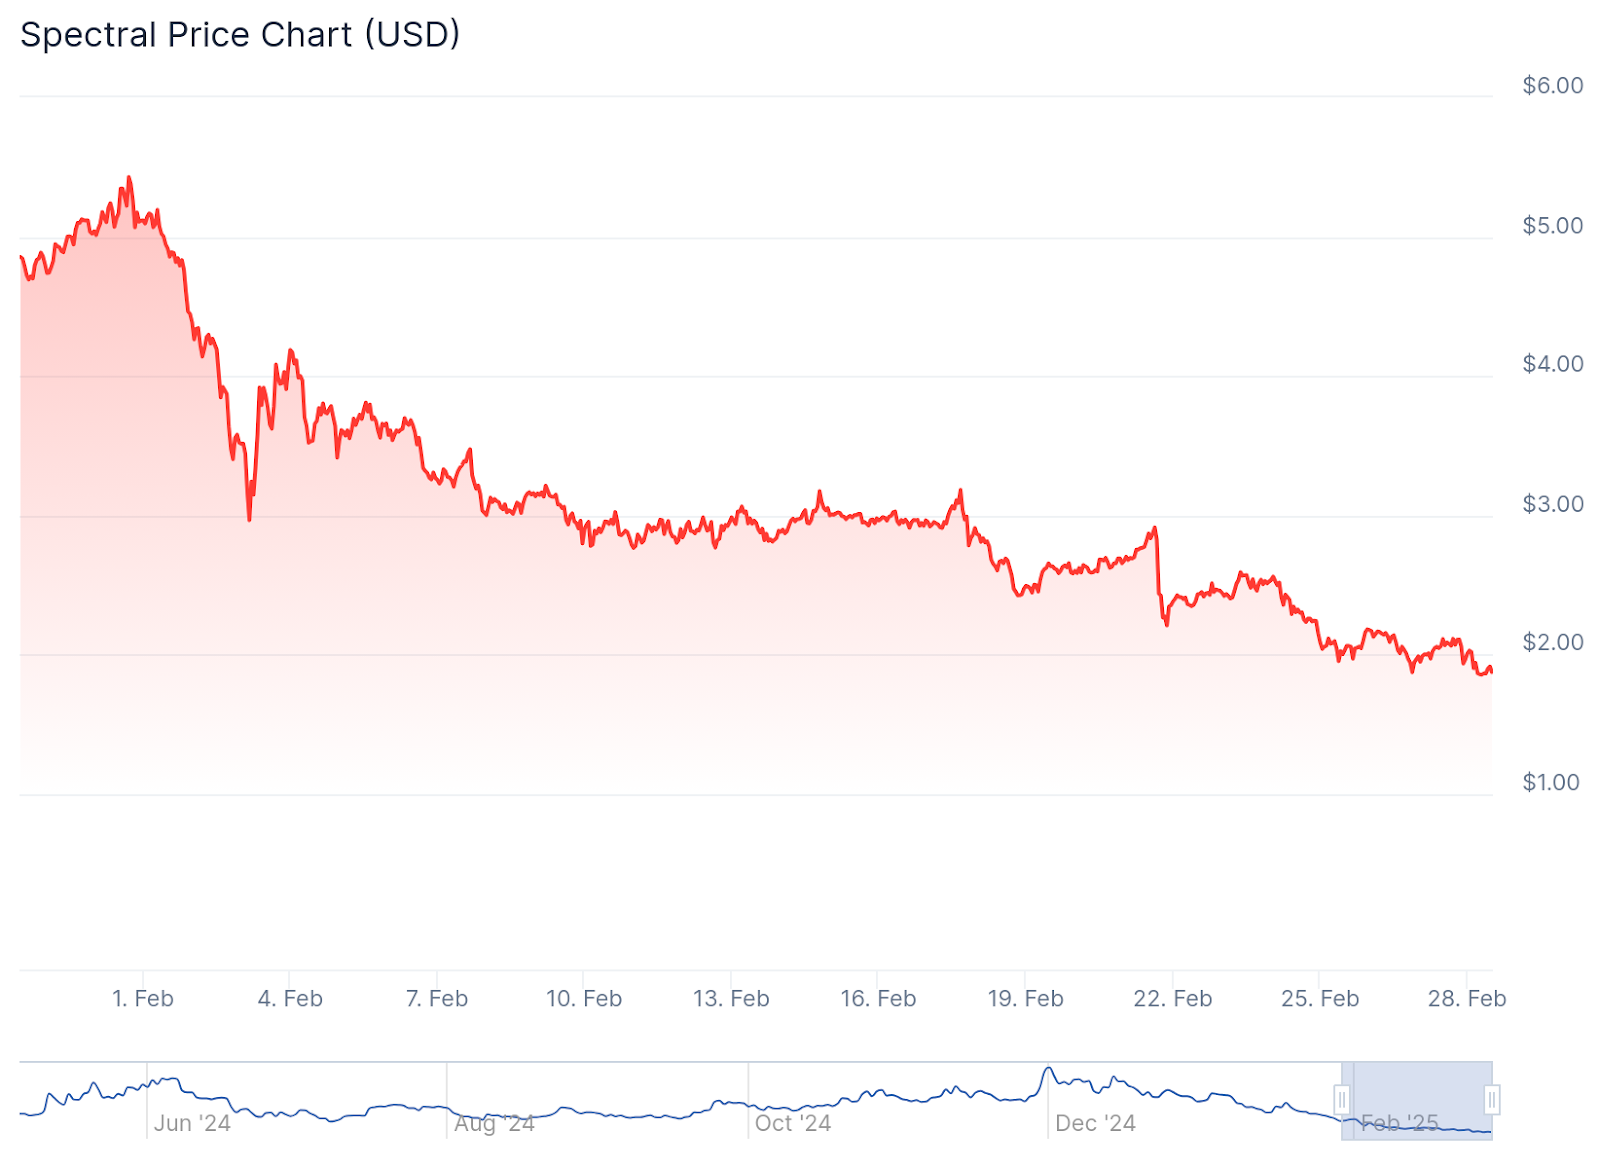
Spectral (SPEC) | -43.9%
With a 43.9% loss, SPEC has been impacted by bearish sentiment across its ecosystem falling from $3.62 (February 5) to $2.03 (February 28). Its market cap also dropped from $51.1M to $28.6M, showing a decline in investor interest.
Bearish Indicators:
- Steady Downtrend: The price dropped consistently from a peak of $3.62 to $2.03, indicating a bearish trend throughout February.
- Decreasing Market Cap: A loss of over $22M in market cap suggests significant sell-offs or reduced demand.
- Fluctuating Trading Volume:
- High trading volume around February 22 ($6.43M) and February 5 ($4.50M) suggests high volatility.
- A decrease in volume toward the end of February indicates weaker buying pressure.
Support & Resistance Levels:
- Current Resistance: $2.18 – $2.40 (Recent price rejection levels).
- Key Support Levels: $1.95 – $2.00 (If broken, further downside is likely).
Potential Recovery Signs:
- A break above $2.40 could signal a trend reversal.
- Higher trading volume exceeding $3M+ per day would indicate renewed investor interest.
- If the market cap stabilizes above $30M, confidence in the token might return
Spectral USD is currently in a strong bearish phase, with the price struggling to hold key levels. If it fails to stay above $2.00, further downside could be expected. However, a breakout above $2.40-$2.50 would suggest a possible recovery.
Final Thoughts
February saw extreme gains and losses, highlighting the volatility of the crypto market. Some key risks for March include:
- Profit-taking & corrections – Assets with extreme rallies may face cooling-off periods.
- Regulatory uncertainty – Potential crackdowns could impact sentiment.
- Liquidity concerns – Low-volume tokens remain vulnerable to manipulation.
Whether February’s top performers can sustain momentum depends on adoption, ecosystem growth, and overall market sentiment. Investors should stay cautious, weighing both risks and opportunities carefully.
Disclaimer: This article is intended solely for informational purposes and should not be considered trading or investment advice. Nothing herein should be construed as financial, legal, or tax advice. Trading or investing in cryptocurrencies carries a considerable risk of financial loss. Always conduct due diligence.
If you would like to read more analyses like this, visit DeFi Planet and follow us on Twitter, LinkedIn, Facebook, Instagram, and CoinMarketCap Community.
Take control of your crypto portfolio with MARKETS PRO, DeFi Planet’s suite of analytics tools.”